


BBB Foods Inc. (“Tiendas 3B” or the “Company”) (NYSE: TBBB), a leading grocery hard discounter in Mexico, announced today its consolidated results for the fourth quarter of 2023 (4Q23) and full fiscal year 2023 ended December 31, 2023. The figures presented in this release are expressed in nominal Mexican Pesos (Ps.) and are prepared in accordance with International Financial Reporting Standards (“IFRS”), unless otherwise stated.
This press release features multimedia. View the full release here: https://www.businesswire.com/news/home/20240425812631/en/
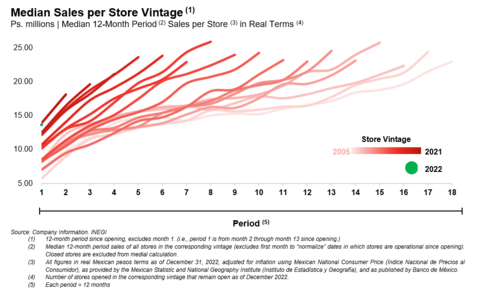
Median Sales per Store Vintage (Graphic: Business Wire)
HIGHLIGHTS
fOURTH qUARTER 2023
- Opened 153 net new stores during the quarter, reaching 2,288 stores as of December 31, 2023.
-
Ps. 12,316 million total revenue for 4Q23.
- 30.8% revenue growth compared to 4Q22.
- Same Store Sales growth 14.9% compared to 4Q22.
- EBITDA reached Ps. 559 million, an increase of 32.9%.
full-year 2023
- Opened 396 net new stores during 2023.
-
Ps. 44,078 million total revenue for the full year.
- 35.3% total revenue growth compared to 2022.
- Same Store Sales growth of 17.6% compared to 2022.
- EBITDA grew by 44.3% to reach Ps. 1,883 million.
- Negative working capital was Ps. 4,559 million, equal to 10.3% of revenue or a 42.2% increase compared to 2022.
- Cash flow from operations increased by 48%
MESSAGE FROM THE CHAIRMAN AND CEO
“Dear Investors,
Ours is a simple but powerful business model that delivered as expected strong results in 2023. We grew total revenue by 35.3%, cash flows from operations by 48.4% and opened a record 396 stores. Driving our performance is razor-sharp focus on execution, offering high value for money to our clients, and increasing our efficiency.
What draws our customers to our stores is the differentiated value we offer our customers. We focus on developing great private labels. In 2023, we increased our private label share to 46.5% of sales. This increasing value to customers is what continues to drive our Same Store Sales growth (17.6% vs. 2022), where even our oldest store vintages continue to post double-digit Same Store Sales growth.
Combined with this revenue growth, our focus on a limited assortment of fast-moving goods allows us to generate increasing amounts of cash from negative working capital changes. Our increasing scale also allows us to negotiate with suppliers even lower prices and to run more efficient operations. We prefer to pass these savings on to our customers.
We opened 396 stores in 2023 reaching a total of 2,288 stores. Our decentralized operating model will allow us to efficiently deploy these stores and to continue growing. We are but at the beginning of our journey. We believe that Mexico has room for no less than 12,000 3B stores.
We continue to invest, anticipating rapid growth. Our operating costs outpaced revenues for the fourth quarter, largely due to one-off factors specifically Hurricane Otis (Acapulco) and pre-IPO expenses, and due to the timing of investments in new stores and distribution centers. Over time we expect costs as a percentage of our sales to be steadily diluted by our growing revenue base.
We are excited to be a public company listed on the NYSE. The proceeds from our IPO have put us in a strong position. Our balance sheet is now rock-solid, and we can now take on and accelerate a select number of high-value projects, while assuring resiliency if challenges were to arise. Being a public company will not change our way of doing business: We will continue to offer our customers the best value proposition, keep our business simple, run a highly efficient operation, and allocate capital to maximize long-term returns to shareholders.
Thank you to our investors, new and old, and to our customers, suppliers, and our team members.”
K. Anthony Hatoum, Chairman and Chief Executive Officer
FINANCIAL RESULTS |
||||||
4Q23 CONSOLIDATED RESULTS |
||||||
(In Ps. Millions, except percentages) |
||||||
|
4Q23 |
As % of Revenue |
4Q22 |
As % of Revenue |
Growth (%) |
Variation (Bps) |
Total Revenue |
Ps. 12,316 |
100.0% |
Ps. 9,416 |
100.0% |
30.8% |
N/A |
Gross Profit |
Ps. 2,011 |
16.3% |
Ps. 1,430 |
15.2% |
40.6% |
114 bps |
Sales Expenses |
Ps. (1,392) |
11.3% |
Ps. (991) |
10.5% |
40.5% |
78 bps |
Administrative Expenses |
Ps. (354) |
2.9% |
Ps. (232) |
2.5% |
52.6% |
41 bps |
Other (Expense) Income – Net |
Ps. (37) |
(0.3)% |
Ps. 7 |
0.1% |
n.m. |
(38) bps |
EBITDA |
Ps. 559 |
4.5% |
Ps. 421 |
4.5% |
32.9% |
7 bps |
Please see the explanation at the end of this release on how EBITDA, a non-IFRS financial measure, is calculated, and for other relevant definitions. |
||||||
TOTAL REVENUE
Total revenue for 4Q23 was Ps. 12,316 million, an increase of 30.8% compared to 4Q22. This increase was mainly due to the revenue increase from the stores with more than one year of operations and, to a lesser extent, the revenue from the 396 new stores opened between the two periods.
GROSS PROFIT AND GROSS PROFIT MARGIN
Gross profit in 4Q23 was Ps. 2,011 million, an increase of 40.6% compared to 4Q22. This increase was driven by sales growth and an improvement in our gross margin of 114 basis points to 16.3% due to effective price negotiations with suppliers.
EXPENSES
Sales expenses refer mainly to the expenses of operating our stores, such as the wages of store employees and energy. In 4Q23, sales expenses reached Ps. 1,392 million, a 40.5% increase compared to 4Q22. This increase in sales expenses was driven by a higher number of stores, as headcount expanded to operate new stores, plus the impact of wage inflation on labor costs. As a percentage of total revenue, sales expenses moved from 10.5% in 4Q22 to 11.3% in 4Q23, an expansion of 78 bps.
Administrative expenses refer to the expenses not related to operating our stores, such as headquarters and regional office expenses. In 4Q23, administrative expenses rose to Ps. 354 million, a 52.6% increase compared to 4Q22. This increase was due to (i) the acquisition of top-tier talent to support our expansion efforts, (ii) expenses incurred in preparation for becoming a public company, (iii) higher regional office expenses in anticipation of the opening of new regions and (iv) non-recurring fees, mainly related to the IPO. As a percentage of total revenue, administrative expenses moved from 2.5% in 4Q22 to 2.9% in 4Q23, an expansion of 41 bps.
Other (expense) income - net, which includes revenues from asset disposals, subleases, and royalties, among others, amounted to an expense of Ps. 37 million in 4Q23, versus income of Ps. 7 million in 4Q22. This variation was mainly due to impairment adjustments of our stores in Acapulco that were impacted by Hurricane Otis. As a percentage of total revenue, other (expense) income – net moved from 0.1% in 4Q22 to negative 0.3% in 4Q23, a change of 38 bps.
EBITDA AND EBITDA MARGIN
In 4Q23, EBITDA reached Ps. 559 million, an increase of 32.9% compared to the 4Q22. This increase can be attributed to our higher gross profit margin offset by the impact of one-off factors discussed below. EBITDA margin for 4Q23 increased slightly by 7 bps to reach 4.5%.
Please see the last section of this release on how we calculate EBITDA and EBITDA Margin, which are non-IFRS financial measures.
To allow our investors to better assess our performance, we are providing the following information:
- Impact of Hurricane Otis: Total impact of Ps. 80 million, reflected in higher cost of sales, sales expenses, and impairment charges.
- IPO expenses: The Company registered Ps. 14 million in IPO-related expenses during 4Q23 which were registered as administrative expenses.
- Building lease payments: The Company leases its stores and distribution centers. In accordance with IFRS 16, the Company’s leasing expenses are capitalized, and not considered operating expenses. Tiendas 3B’s capitalized lease costs payments for buildings were Ps. 293 million in 4Q23.
FINANCIAL COSTS AND NET LOSS
Financial costs were Ps. 519 million, an increase of 52.5% compared to 4Q22. This was mainly explained by the financial costs associated with our promissory notes and convertible notes that were outstanding in 4Q23 but were repaid in full with the proceeds of our IPO in February 2024 and, by the incremental interest cost on lease liabilities associated with lease agreements of the stores and distribution centers opened in 2023.
During 4Q23, we had a foreign exchange gain of Ps. 202 million explained by the Mexican peso appreciation against the U.S. dollar, mainly because our promissory notes and convertible notes were denominated and payable in U.S. dollars.
Income tax expenses reached Ps. 14 million in the 4Q23 compared to Ps. 72 million in 4Q22.
As a consequence, our net loss for the 4Q23 was Ps. 97 million, compared to a net profit of Ps. 19 million for the 4Q22.
FULL YEAR 2023 CONSOLIDATED RESULTS |
||||||
(In Ps. Millions, except percentages) |
||||||
|
2023 |
As % of Revenue |
2022 |
As % of Revenue |
Growth (%) |
Variation (Bps) |
Total Revenue |
Ps. 44,078 |
100.0% |
Ps. 32,580 |
100.0% |
35.3% |
N/A |
Gross Profit |
Ps. 7,040 |
16.0% |
Ps. 4,925 |
15.1% |
42.9% |
86 bps |
Sales Expenses |
Ps. (4,823) |
10.9% |
Ps. (3,461) |
10.6% |
39.4% |
32 bps |
Administrative Expenses |
Ps. (1,387) |
3.1% |
Ps. (952) |
2.9% |
45.7% |
22 bps |
Other (Expense) Income – Net |
Ps. (36) |
(0.1)% |
Ps. 8 |
0.0% |
n.m. |
(11) bps |
EBITDA |
Ps. 1,883 |
4.3% |
Ps. 1,305 |
4.0% |
44.3% |
27 bps |
Please see the explanation at the end of this release on how EBITDA, a non-IFRS financial measure, is calculated, and for other relevant definitions. |
||||||
TOTAL REVENUE
Total revenue for 2023 was Ps. 44,078 million, an increase of 35.3% compared to 2022. In 2023, our sales growth was mainly driven by a 30.2% increase in the total number of transactions, reaching 534 million transactions up from 410 million transactions in 2022. The average ticket size went from Ps. 79.3 in 2022 to Ps. 82.5 in 2023, an increase of 4.0%. This revenue increase was mainly due to the stores with more than one year of operation performing better, and, to a lesser extent, the revenue from the 396 new stores opened in 2023.
GROSS PROFIT AND GROSS PROFIT MARGIN
Gross profit in 2023 was Ps. 7,040 million, an increase of 42.9% compared to 2022. This was driven by sales growth and an improvement of our gross margin of 86 basis points to 16.0% due to effective negotiations with suppliers.
EXPENSES
In 2023, sales expenses reached Ps. 4,823 million, a 39.4% increase compared to 2022. This increase in sales expenses was driven by the increase in the number of stores, as headcount expanded to operate new stores, plus the impact of wage inflation on labor costs. As a percentage of total revenue, sales expenses moved from 10.6% in 2022 to 10.9% in 2023, an expansion of 32 bps.
In 2023, administrative expenses reached Ps. 1,387 million, a 45.7% increase compared to 2022. This increase was due to (i) the acquisition of top-tier talent to support our expansion efforts, (ii) the expenses incurred to meet our public company obligations, (iii) regional office expenses increased in anticipation of the opening of new regions, and (iv) non-recurring expenses, mainly related to the IPO. As a percentage of total revenue, administrative expenses moved from 2.9% in 2022 to 3.1% in 2023, an expansion of 22 bps.
Other (expense) income – net amounted to an expense of Ps. 36 million in 2023, versus income of Ps. 8 million in 2022. This variation was mainly due to impairments adjustments of our stores in Acapulco that were impacted by Hurricane Otis.
EBITDA AND EBITDA MARGIN
In 2023, EBITDA reached Ps. 1,883 million, an increase of 44.3% compared to 2022. EBITDA Margin moved from 4.0% in 2022 to 4.3% in 2023, an expansion of 27 bps. This increase can be attributed to our higher gross profit margin offset by the impact of one-off factors discussed below.
Please see the last section of this release on how we calculate EBITDA and EBITDA Margin, which are non-IFRS financial measures.
To allow our investors to better assess our performance, we are providing the following information:
- Impact of Hurricane Otis: Total impact of Ps. 80 million reflected in higher cost of sales, sales expenses, and impairment charges
- IPO expenses: The Company incurred Ps. 37 million in IPO-related expenses during 2023, of which Ps. 28 million were registered as administrative expenses and Ps. 9 million were capitalized as advance payments.
- Building lease payments: The Company leases its stores and distribution centers, in accordance with IFRS 16, the Company’s leasing expenses are capitalized, and not considered operating expenses. Tiendas 3B’s capitalized lease costs payments for buildings were Ps. 1,072 million in 2023.
FINANCIAL COSTS AND NET LOSS
Financial costs were Ps. 1,527 million in 2023, an increase of 30.7% compared to 2022, mainly explained by the financial costs associated with our promissory notes and convertible notes that were outstanding in 2023 but were repaid in full with the proceeds of our IPO in February 2004, and by the incremental interest cost on lease liabilities associated with the leasing agreements of the stores and distribution centers opened in 2023.
During 2023, we reported a foreign exchange gain of Ps. 606 million explained by the Mexican peso appreciation as the promissory notes and convertible notes are issued in U.S. dollars.
Our income tax expenses reached Ps. 205 million in 2023 compared to Ps. 201 million in 2022.
In consequence, our net loss for 2023 was Ps. 306 million, compared to a net loss of Ps. 565 million for 2022.
BALANCE SHEET AND LIQUIDITY
As of December 31, 2023, the Company reported cash and cash equivalents of Ps. 1,220 million. Total debt with related parties and third parties reached Ps. 5,662 million which included Ps. 872 and Ps. 4,790 in amounts payable in respect of pay-in-kind promissory notes and convertible notes, respectively. Following our IPO in February 2024, we repaid in full these pay-in-kind promissory notes and convertible notes.
CASH FLOW STATEMENT |
|||
(In Ps. Millions, except percentages) |
|||
|
2023 |
2022 |
Growth (%) |
Net cash flows provided by operating activities |
Ps. 3,140 |
Ps. 2,116 |
48.4% |
Net cash flows used in investing activities |
Ps. (1,779) |
Ps. (1,111) |
60.1% |
Net cash flows used in financing activities |
Ps. (1,096) |
Ps. (1,027) |
6.7% |
Net (decrease) increase in cash and cash equivalents |
Ps. 266 |
Ps. (22) |
n.m. |
Our business model continues to generate a significant amount of cash from our negative working capital cycle due to our increasing sales and high inventory turns. This robust cash flow has enabled us to fund internally our growth initiatives, including the expansion of new stores and distribution centers.
The information provided below offer a view of our financial activities in 2023:
Net cash flows provided by operating activities increased to Ps. 3,140 million in 2023 from Ps. 2,116 million in 2022. This was mainly driven by an increase in negative working capital, stemming from the increase in total revenue. As a percentage of total revenue, negative working capital increased to 10.3% in 2023 up from 9.8% in 2022.
Net cash flows used in investing activities were Ps. 1,779 million for 2023, compared to Ps. 1,111 million in 2022. This is primarily due to the increase in property, plant & equipment (PP&E) related to the opening of new stores and three distribution centers, one of which opened in 2023 and the other two opened in Q12024.
Net cash flows used in financing activities were Ps. 1,096 million for 2023, compared to Ps. 1,027 million in 2022, and consisted principally of lease payments.
KEY OPERATING METRICS |
|||
|
2023 |
2022 |
Variation (%) |
Number of Stores Opened |
396 |
392 |
1.0% |
Number Distribution Centers |
14 |
13 |
n.m. |
Same Store Sales Growth (%) |
17.6% |
21.9% |
n.m. |
Private label Sales Products (% of Sales of Merchandise) |
46.5% |
42.8% |
370 bps |
Average Ticket Size (1) |
Ps. 82.4 |
Ps. 79.30 |
4.0% |
Number Transactions (2) |
25,635 |
23,767 |
7.9% |
| (1) | We calculate “Average Ticket Size” by dividing revenue from Sales of Merchandise by the total number of transactions. |
|
| (2) | Number of transactions is derived from stores that have been operating for 5+ years. |
During 2023, we opened 396 stores which is in line with the 392 stores we opened in 2022. In 4Q23 we opened 153 stores. To support the incremental number of stores, in 2023 we opened our 14th distribution center.
Same Store Sales grew by 14.9% for 4Q23, compared to 19.4% for 4Q22. For the year 2023, Same Store Sales increased by 17.6%, compared to 21.9% for 2022. The slowdown in Same Store Sales growth is due in large part to the decrease in inflation from 2022 to 2023.
Our private label offering continues to gain as a share of sales of merchandise. The share of revenue from private labels increased from 42.8% in 2022 to 46.5% in 2023.
STORE PERFORMANCE BY VINTAGE
Our Sales per Store curves have shown a consistent upward trend across store vintages from 2005 to 2022. The data, adjusted for inflation, reflects growing sales maturity over time, with earlier vintages setting the baseline for comparison.
The chart above shows the consistency of our execution in store openings. Sales per Store of all of our vintages continue to grow. In particular, we note that (i) our 2021 vintage with 251 stores has outperformed all previous cohorts and (ii) our 2022 vintage represented in green with 394 stores, has started off equally strong.
2024 GUIDANCE |
|
|
Range |
Same Store Sales Growth (%) |
Mid-teens |
Revenue Growth (%) |
28% - 32% |
Number of New Stores |
380 - 420 |
For 2024, the Company plans to open between 380 and 420 stores during the year. We expect Same Store Sales growth in the mid-teens and total revenue is forecast to grow by 28% to 32%. This guidance is predicated on the prevailing consensus regarding the outlook for the Mexican economy and is subject to change, particularly if Mexico’s economic performance deviates from current expectations.
Disclaimer
The foregoing 2024 guidance reflects management’s current assumptions regarding numerous evolving factors that are difficult to accurately predict, including those discussed in the “Risk Factors” section set forth in the Company’s Registration Statement on Form F-1 filed with the U.S. Securities and Exchange Commission (the “SEC”) and the Company’s Annual Report on Form 20-F to be filed with the SEC.
A reconciliation of the forward-looking non-IFRS measure, specifically the 2024 EBITDA Margin guidance, to the relevant forward-looking IFRS measure is not being provided, as the Company does not currently have sufficient data to accurately estimate the variables and individual adjustments for such guidance and reconciliation. Due to this uncertainty, the Company cannot reconcile projected EBITDA Margin to projected net profit/loss without unreasonable effort.
The 2024 guidance constitutes forward-looking statements. For more information, see “Forward-Looking Statements” in this release.
Non-IFRS Measures and Other Calculations
For the convenience of investors, this release presents certain non-IFRS financial measures, which are not calculated in accordance with IFRS (“non-IFRS financial measures”). A non-IFRS financial measure is generally defined as one that purports to measure financial performance but excludes or includes amounts that would not be so excluded or included in the most comparable IFRS financial measure. Non-IFRS financial measures do not have standardized meanings and may not be directly comparable to similarly titled measures reported by other companies. These non-IFRS financial measures are used by our management for decision-making purposes and to assess our financial and operating performance, generate future operating plans and make strategic decisions regarding the allocation of capital. The non-IFRS financial measures presented herein have limitations as analytical tools, and you should not consider them in isolation or as substitutes for analysis of our results of operations presented in accordance with IFRS. Additionally, our calculations of non-IFRS financial measures may be different from the calculations used by other companies, including our competitors, and therefore, our non-IFRS financial measures may not be comparable to those of other companies.
We calculate “EBITDA”, a non-IFRS measure, as net income (loss) for the period, plus income tax expense, financial costs, net, and total depreciation and amortization.
We calculate “EBITDA Margin”, a non-IFRS measure, for a period by dividing EBITDA for the corresponding period by total revenue for such period.
Same Store Sales: We measure “Same Store Sales” using revenue from sales of merchandise from stores that were operational for at least the full preceding 12 months for the periods under consideration. When calculating this measure, we exclude stores that were temporarily closed (for one month or more) or permanently closed during the periods in consideration.
Lease Costs: Consistent with lease accounting required under IFRS 16, total depreciation and amortization includes the depreciation expense of right-of-use-asset corresponding to long-term leases, which is a non-cash expense. Such amounts, together with the interest expense on lease liabilities, is a proxy for but not equal to the Company’s actual cash expenditure incurred in connection with its leased properties.
Sales per Store: We define our “Sales per Store” as the average of the revenue from sales of merchandise achieved by our stores that were open for the full year in consideration. When calculating this measure, we exclude stores that were temporarily closed (for one month or more) or permanently closed during the period in consideration. This measure assists our management’s understanding of how store performance has evolved across different vintages. Sales per Store also serves as a benchmark to measure the performance of new stores and is useful to set growth and expansion targets.
CONFERENCE CALL DETAILS
Tiendas 3B will host a call to discuss the fourth quarter and full year 2023 results on April 26th, 2024, at 10:00 a.m. Eastern Time. A webcast of the call will be accessible on: https://events.q4inc.com/attendee/187339444. To join via telephone, please dial +1800-267-6316 or +1203-518-9783 (International). The conference ID is 3BFQ4.
An audio replay from the conference call will be available on the Tiendas 3B website https://www.investorstiendas3b.com after the call.
FORWARD-LOOKING STATEMENTS
This release includes forward-looking statements within the meaning of Section 27A of the U.S. Securities Act of 1933, as amended, and Section 21E of the U.S. Securities Exchange Act of 1934, as amended. We base these forward-looking statements on our current beliefs, expectations and projections about future events and trends affecting our business and our market. Many important factors could cause our actual results to differ substantially from those anticipated in our forward-looking statements. Forward-looking statements are not guarantees of future performance. Forward-looking statements speak only as of the date they are made, and we undertake no obligation to update publicly or to revise any forward-looking statements. New risks and uncertainties emerge from time to time, and it is not possible for us to predict all risks and uncertainties that could have an impact on the forward-looking statements contained in this release. The words “believe,” “may,” “should,” “aim,” “estimate,” “continue,” “anticipate,” “intend,” “will,” “expect” and similar words are intended to identify forward-looking statements. Forward-looking statements include information concerning our possible or assumed future results of operations, business strategies, capital expenditures, financing plans, competitive position, industry environment, potential growth opportunities, the effects of future regulation and the effects of competition. Considering these limitations, you should not make any investment decision in reliance on forward-looking statements contained in this release.
ABOUT TIENDAS 3B
BBB Foods Inc., a proudly Mexican company, is a pioneer and leader of the grocery hard discount model in Mexico and one of the fastest growing retailers in the country as measured by its sales and store growth rates. The 3B name, which references "Bueno, Bonito y Barato" - a Mexican saying which translates to "Good, Nice and Affordable" - summarizes Tiendas 3B’s mission of offering irresistible value to budget savvy consumers through great quality products at bargain prices. By delivering value to the Mexican consumer, we believe we contribute to the economic well-being of Mexican families. In a landmark achievement, Tiendas 3B was listed on the New York Stock Exchange in February 2024 under the ticker symbol “TBBB.”
For more information, please visit: https://www.investorstiendas3b.com
FINANCIAL STATEMENTS |
|||||||
Consolidated Income Statement |
|||||||
(Unaudited) |
|||||||
For the three months and years ended December 31, 2023, and December 31, 2022 |
|||||||
(In thousands of Mexican pesos) |
|||||||
For the Years Ended December 31, |
For the Three Month Period Ended December 31, |
||||||
2023 |
2022 |
% |
2023 |
2022 |
% |
||
|
|
|
|
|
|
|
|
Revenue From Sales of Merchandise |
Ps.43,987,803 |
Ps.32,472,577 |
35.5% |
|
Ps.12,293,230 |
Ps.9,391,177 |
30.9% |
Sales of Recyclables |
90,656 |
107,820 |
(15.9%) |
22,374 |
24,442 |
(8.5%) |
|
Total Revenue |
44,078,459 |
32,580,397 |
35.3% |
|
12,315,604 |
9,415,619 |
30.8% |
Cost of Sales |
(37,038,542) |
(27,655,643) |
33.9% |
(10,304,939) |
(7,985,538) |
29.0% |
|
Gross Profit |
7,039,917 |
4,924,754 |
42.9% |
|
2,010,665 |
1,430,081 |
40.6% |
Gross Profit Margin |
16.0% |
15.1% |
|
|
16.3% |
15.2% |
|
Sales Expenses |
(4,822,912) |
(3,460,840) |
39.4% |
(1,391,882) |
(990,865) |
40.5% |
|
Administrative Expenses |
(1,386,929) |
(952,090) |
45.7% |
|
(353,785) |
(231,818) |
52.6% |
Other (Expense) Income - Net |
(36,213) |
8,445 |
n.m. |
|
(36,905) |
7,430 |
n.m. |
Operating Profit |
793,863 |
520,269 |
52.6% |
|
228,093 |
214,828 |
6.2% |
Operating Profit Margin |
1.8% |
1.6% |
|
|
1.9% |
2.3% |
|
Financial Income |
26,069 |
19,840 |
31.4% |
|
5,559 |
5,326 |
4.4% |
Financial Costs |
(1,527,107) |
(1,168,786) |
30.7% |
(519,239) |
(340,436) |
52.5% |
|
Exchange Rate Fluctuation |
606,270 |
264,930 |
128.8% |
|
202,348 |
211,408 |
(4.3%) |
Financial Cost - Net |
(894,768) |
(884,016) |
1.2% |
(311,332) |
(123,702) |
151.7% |
|
Loss Before Income Tax |
(100,905) |
(363,747) |
(72.3%) |
|
(83,239) |
91,126 |
(191.3%) |
Income Tax Expense |
(205,248) |
(201,363) |
1.9% |
(13,745) |
(72,036) |
(80.9%) |
|
Net Loss for the Period |
Ps.(306,153) |
Ps.(565,110) |
(45.8%) |
|
Ps.(96,984) |
Ps.19,090 |
(608.0%) |
Net Profit Margin |
(0.7%) |
(1.7%) |
|
|
(0.8%) |
0.2% |
|
|
|
|
|
|
|
|
|
EBITDA Reconciliation |
|
|
|
|
|
|
|
Net Loss for the Period |
Ps.(306,153) |
Ps.(565,110) |
(45.8%) |
|
Ps.(96,984) |
Ps.19,090 |
(608.0%) |
Net Profit Margin |
(0.7%) |
(1.7%) |
|
|
(0.8%) |
0.2% |
|
Income Tax Expense |
205,248 |
201,363 |
1.9% |
13,745 |
72,036 |
(80.9%) |
|
Financial Cost - Net |
894,768 |
884,016 |
1.2% |
|
311,332 |
123,702 |
151.7% |
D&A |
1,089,096 |
785,054 |
38.7% |
331,050 |
206,015 |
60.7% |
|
EBITDA |
Ps.1,882,959 |
Ps.1,305,323 |
44.3% |
|
Ps.559,143 |
Ps.420,843 |
32.9% |
EBITDA Margin |
4.3% |
4.0% |
|
|
4.5% |
4.5% |
|
Consolidated Balance Sheet |
|||
(Unaudited) |
|||
As of December 31, 2023, and December 31, 2022 |
|||
(In thousands of Mexican pesos) |
|||
| As of December 31, | |||
2023 |
2022 |
||
| Current Assets: | |||
| Cash and Cash Equivalents | Ps.1,220,471 |
Ps.984,976 |
|
| Sundry Debtors | 11,020 |
19,885 |
|
| VAT Receivable | 731,186 |
609,581 |
|
| Advanced Payments | 72,998 |
53,155 |
|
| Inventories | 2,357,485 |
1,931,605 |
|
| Total Current Assets | Ps.4,393,160 |
Ps.3,599,202 |
|
| Non-Current Assets: | |||
| Guarantee Deposits | Ps.33,174 |
Ps.27,741 |
|
| Property, Furniture, Equipment,and Lease-hold Improvements | 4,606,300 |
3,164,204 |
|
| Right-of-use Assets - Net | 5,520,596 |
4,696,459 |
|
| Intangible Assets - Net | 6,771 |
8,241 |
|
| Deferred Income Tax | 403,801 |
299,060 |
|
| Total Non-current Assets | Ps.10,570,642 |
Ps.8,195,705 |
|
| Total Assets | Ps.14,963,802 |
Ps.11,794,907 |
|
| Current liabilities: | |||
| Suppliers | Ps.7,126,089 |
Ps.5,390,192 |
|
| Accounts Payable and Accrued Expenses | 322,959 |
273,731 |
|
| Income Tax Payable | 2,326 |
73,304 |
|
| Bonus Payable to Related Parties | 78,430 |
43,834 |
|
| Short-term Debt | 744,137 |
491,236 |
|
| Lease Liabilities | 537,515 |
417,307 |
|
| Employees' Statutory Profit Sharing Payable | 140,485 |
114,798 |
|
| Total Current Liabilities | Ps.8,951,941 |
Ps.6,804,402 |
|
| Non-current liabilities: | |||
| Debt with Related Parties | Ps.4,340,452 |
Ps.4,276,058 |
|
| Bonus Payable to Related Parties | - |
44,528 |
|
| Long-term Debt | 577,318 |
540,734 |
|
| Lease Liabilities | 5,706,707 |
4,828,135 |
|
| Employee Benefits | 22,232 |
14,311 |
|
| Total Non-current Liabilities | Ps.10,646,709 |
Ps.9,703,766 |
|
| Total Liabilities | Ps.19,598,650 |
Ps.16,508,168 |
|
| Stockholders' Equity: | |||
| Capital Stock | Ps.471,282 |
Ps.471,282 |
|
| Reserve for Share-based Payments | 851,701 |
467,135 |
|
| Cumulatives Losses | (5,957,831) |
(5,651,678) |
|
| Total Stockholders' Equity | (Ps.4,634,848) |
(Ps.4,713,261) |
|
| Total Liabilities and Stockholders' Equity | Ps.14,963,802 |
Ps.11,794,907 |
|
Cash Flow Statement |
|||
(Unaudited) |
|||
| For the years ended December 31, 2023, and December 31, 2022 | |||
| (In thousands of Mexican pesos) | |||
| For the Years Ended December 31, | |||
2023 |
2022 |
||
| Loss before income tax | Ps.(100,905) |
Ps.(363,747) |
|
| Adjustments for: | |||
| Depreciation of property and equipment | 488,409 |
297,743 |
|
| Depreciation of right-of-use assets | 598,031 |
484,916 |
|
| Amortization of intangible assets | 2,655 |
2,395 |
|
| Impairment of property and equipment | 42,422 |
- |
|
| Costs related with defined benefits to employees | 3,873 |
3,631 |
|
| Interest payable on Promissory Notes | 619,779 |
615,592 |
|
| Interest expense on lease liabilities | 762,872 |
507,875 |
|
| Interest on debt and bonus payable to related parties | 29,747 |
45,319 |
|
| Loss related to modification and remeasurement of Promissory Notes | 84,236 |
- |
|
| Finance income | (26,069) |
(19,840) |
|
| Exchange fluctuation | (610,703) |
(285,990) |
|
| Share-based payment expense | 384,566 |
303,789 |
|
2,278,913 |
1,591,683 |
||
| Increase in inventories | (425,880) |
(528,363) |
|
| Increase in other current assets and guarantee deposits | (138,014) |
(233,823) |
|
| Increase in suppliers (including supplier finance arrangements) | 1,735,897 |
1,496,811 |
|
| Increase in other current liabilities | 78,963 |
87,344 |
|
| (Decrease) Increase on bonus payable to related parties | (8,564) |
10,688 |
|
| Income taxes paid | (380,967) |
(308,005) |
|
| Net cash flows provided by operating activities | 3,140,349 |
2,116,335 |
|
| Purchase of property and equipment | (1,798,019) |
(1,122,877) |
|
| Sale of property and equipment | 3,776 |
2,646 |
|
| Investment in intangible assets | (1,185) |
(2,805) |
|
| Interest received on short-term investments | 16,639 |
11,686 |
|
| Net cash flows used in investing activities | (1,778,789) |
(1,111,350) |
|
| Payments made on reverse factoring transactions-net of commissions received | (2,074,890) |
(1,409,089) |
|
| Finance obtained through supplier finance arrangements | 2,195,833 |
1,528,143 |
|
| Proceeds from Promissory Notes | - |
- |
|
| Proceeds credit lines | 99,618 |
82,527 |
|
| Payment of debt | (104,769) |
(360,107) |
|
| Interest payment on debt | (25,224) |
(41,859) |
|
| Lease payments | (1,186,260) |
(826,730) |
|
| Net cash flows used in financing activities | (1,095,692) |
(1,027,115) |
|
| Net (decrease) increase in cash and cash equivalents | 265,868 |
(22,130) |
|
| Effect of foreign exchange movements on cash balances | (30,373) |
7,066 |
|
| Cash and cash equivalents at beginning of year | 984,976 |
1,000,040 |
|
| Cash and cash equivalent at end of year | Ps.1,220,471 |
Ps.984,976 |
|
View source version on businesswire.com: https://www.businesswire.com/news/home/20240425812631/en/
Contacts
INVESTOR RELATIONS CONTACT
Andrés Villasis
ave@tiendas3b.com
