


Like Icarus, solar stocks flew too close to the sun and burned out in 2023. While the S&P 500 index is trading up 20% year-to-date (YTD), the Invesco Solar ETF (NYSEARCA: TAN) is trading down 22.5%. Many of last year’s winning solar, clean and renewable energy technology companies are significantly down. Solar microinverter makers Enphase Energy Inc. (NASDAQ: ENPH) and SolarEdge Technologies Inc. (NASDAQ: SEDG) are down 61.4% and 50.85% yearly. Much of the weakness centers around normalizing stock prices after the robust performance in 2022, heading into 2023 with strength.
Two stocks are defying the selling pressure and swimming upstream. These stocks are beacons of bullishness that bears can't seem to break. The relative strength of these two stocks makes them either laggards to sell off if the selling pressure continues in the sector or leaders to bounce when the sector bottoms and bounces.
Array Technologies Inc. (NASDAQ: ARRY)
If you've ever seen time-lapse videos showing rows of giant solar panels that all adjust and turn throughout the day following the sun, then you’ve seen Array Technologies products in action. Array designs and manufactures solar trackers used in utility-scale solar projects worldwide.
These are devices that automatically adjust and tilt solar panels to track the sun throughout the day to gain maximum sunlight, generating up to 20% more solar energy. Solar trackers are more efficient than fixed-tilt solar panels. They also enable solar panels to be placed on land with obstructions or uneven land. In a nutshell, solar trackers help operators reduce costs while maximizing energy production. Array generates revenues from the devices, software and support.
Solid Results Through and Through
Array released its second-quarter 2023 earnings on Aug. 8, 2023. The company reported earnings-per-share (EPS) of 47 cents, doubling the consensus estimates of 18 cents, beating by 29 cents. Revenues climbed 21% YoY to $507.73 million, beating $448.69 consensus analyst estimates.
Array ended the quarter with $1.7 billion in bookings, adding $600 million in the quarter. Gross margins rose 2,010 bps to 29.6% from 9.5% last year. This major gross margin improvement was derived from improved pass-through pricing, freight and higher margins on non-tracker sales.
Mixed Guidance
Array took a cautious stance on guidance. For the full-year 2023, the company raised adjusted EBITDA from $280 million to $295 million, up from $240 million to $265 million. This results in a raised EPS from $1.00 to $1.07, from the previous guidance of 75 to 85 cents. However, revenue estimates were reduced to $1.65 billion to $1.725 billion, from previous guidance of $1.80 billion to $1.90 billion.
Array Technologies analyst ratings and price targets are at MarketBeat.
Array Technologies peers and competitor stocks can be found with the MarketBeat stock screener.
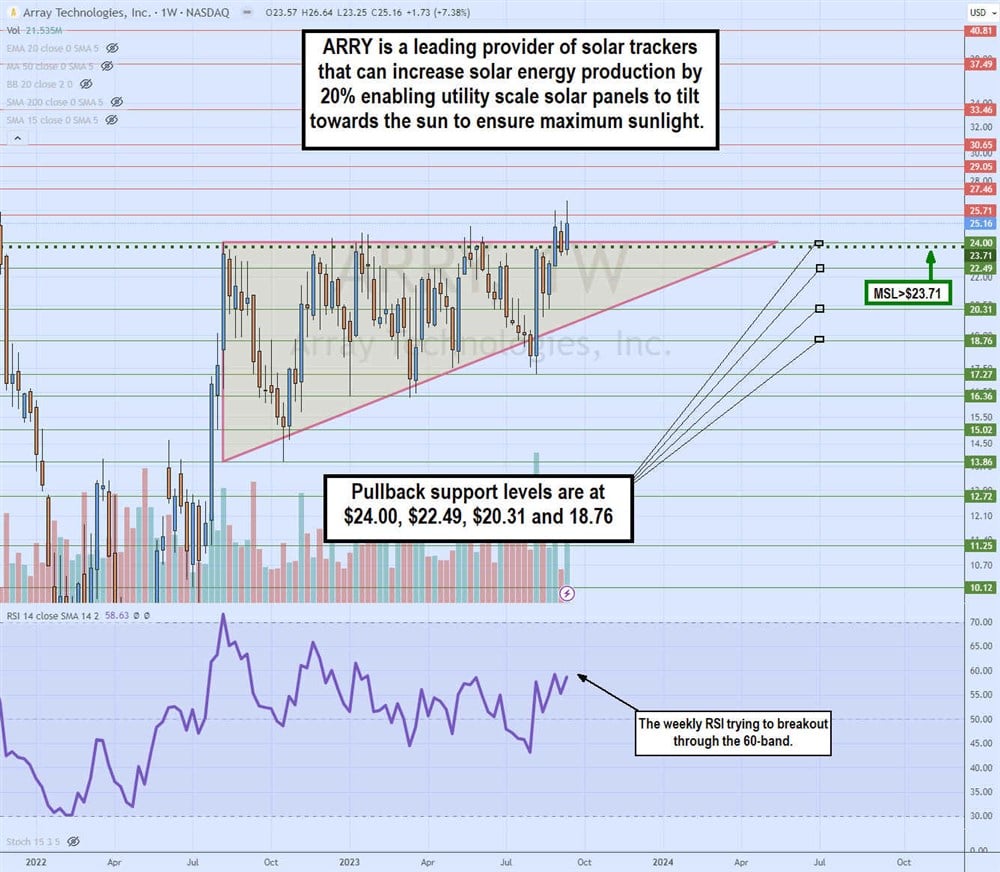
Weekly Ascending Triangle Breakout
ARRY has been forming a weekly ascending triangle since Aug. 22, 2023, after peaking at $24.00 and falling to a low of $13.86 in October 2022. ARRY made the journey of climbing back up to the flat-top horizontal resistance at $24.00, only to get rejected and fall back down. Each sell-off was supported at higher lows, creating the diagonal ascending trendline.
ARRY shares spiked back up to test and eventually broke through the flat-top resistance upon triggering the weekly market structure low (MSL) breakout through the $23.71 trigger. Pullback supports are at $24.00 triangle flat-top trendline, $22.49, $20.31 and $18.76.
First Solar Inc. (NASDAQ: FSLR)
The pioneer and leader in thin-film solar photovoltaic (PV) modules continues to lead its segment. Thin-film solar differs from the typical crystalline silicon solar panels. Thin-film uses cadmium telluride solar cells, which have some major benefits. Thin-film modules are flexible and light versus rigid solar panels, which enables them to integrate into roofing materials or building facades.
The thin film can perform better in low-light conditions when the sun isn't directly overhead and has less degradation under high temperatures. Thin film can be produced in various colors and are semi-transparent, which makes them adaptable to infinite design and architecture options.
Conversely, thin film has less efficiency, meaning more power per unit on the surface than monocrystalline and polycrystalline solar panels. Thin-film is no longer cheaper than traditional crystalline solar panels as the costs have decreased dramatically.
Thin Film Equals Thick Profits
On July 27, 2023, First Solar reported its second-quarter 2023 earnings report for the period ending June 2023. The company reported EPS of $1.59, crushing the $1.00 consensus analyst estimates by 59 cents and up from 40 cents net income in the year-ago period. Revenues rose 30.6% YoY to $811 million, beating consensus analyst estimates for $722.22 million.
YTD net bookings rose to 21.1 GW. The company ended the quarter with $1.5 billion in cash. First Solar will invest $1.1 billion in building its fifth new vertically integrated manufacturing facility in the U.S.
First Solar CEO Mark Widmar commented, “With half of 2023 behind us, we continue to see strengthened commercial, operational, and financial foundations, both in 2023 and in the coming years as we continue to grow. The second quarter of the year continued the steady progress established in the first, as we ramped up production and delivery of our next-generation Series 7 modules, reinforced our global leadership in thin film PV with a strategic acquisition, and continued our strong bookings and ASP momentum.”
First Solar analyst ratings and price targets are at MarketBeat.
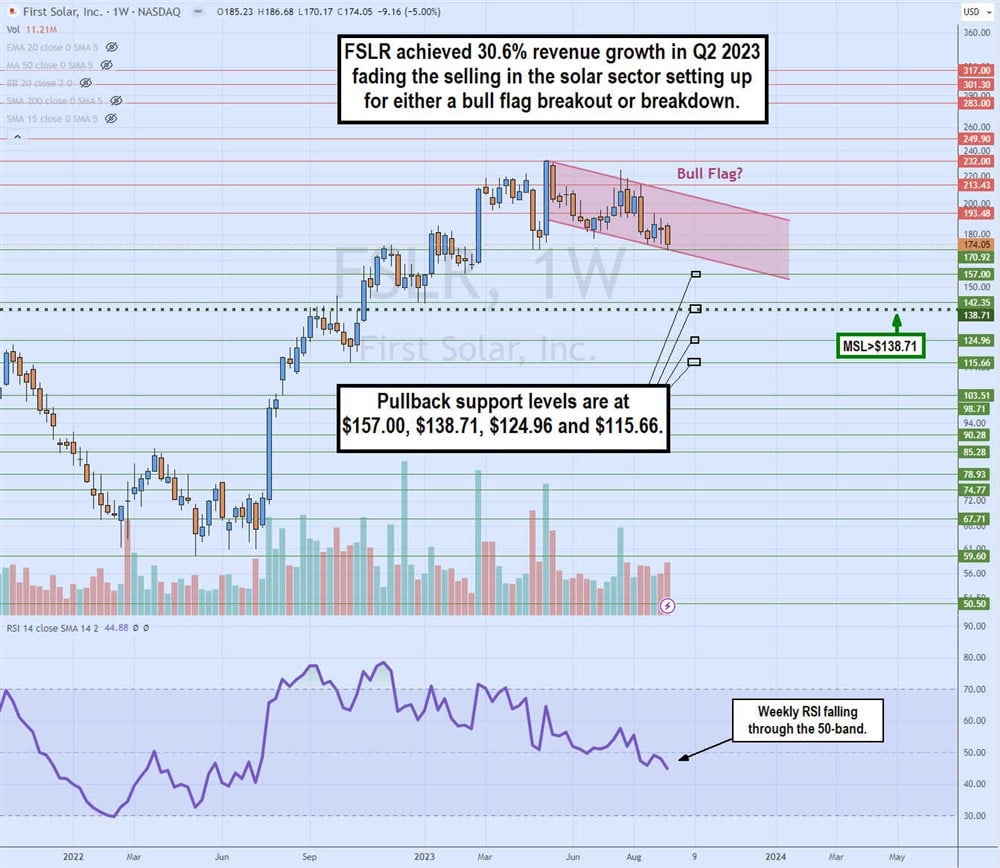
Weekly Bull Flag or Descending Price Channel?
The weekly candlestick chart on FSLR illustrates the nearly parabolic rise from $59.60 lows in May 2022 to the $232 high made a year later in May 2023, forming a steep flagpole. FSLR has been making lower and lower highs since the peak as the weekly RSI drifts lower through the 50-band. If the selling continues, the parallel descending price channel will eventually resolve in a bull flag on the breakout through the descending upper trendline or a breakdown. Pullback supports are at $157.00, $138.71 weekly MSL trigger, $124.96 and $115.46.
