


Warren Buffett’s holding company, Berkshire Hathaway Inc. (BRK.B), experienced a notable increase in its first-quarter earnings, primarily due to a resurgence in its insurance business. Furthermore, the conglomerate’s cash hoard grew to $130.62 billion, up from $128 billion in the fourth quarter of 2022. During the same period, Berkshire Hathaway repurchased $4.40 billion worth of stock, marking the highest since the first quarter of 2021 and an increase from $2.8 billion at the end of 2022.
While the company’s stable financial standing reassures investors, its subsidiary PacifiCorp, an electric utility, is currently embroiled in legal proceedings. PacifiCorp was found liable by a jury for the destruction caused by the 2020 Labor Day Fires in Oregon, which may result in punitive damages beyond its net worth of $10.7 billion.
With investor confidence shaken and market volatility persisting, it may be prudent to wait for a better entry point in the stock. Let’s look at the trends of some of its key financial metrics.
Analyzing Berkshire Hathaway’s Financial Performance: Net Income, Revenue, and Gross Margin Trends
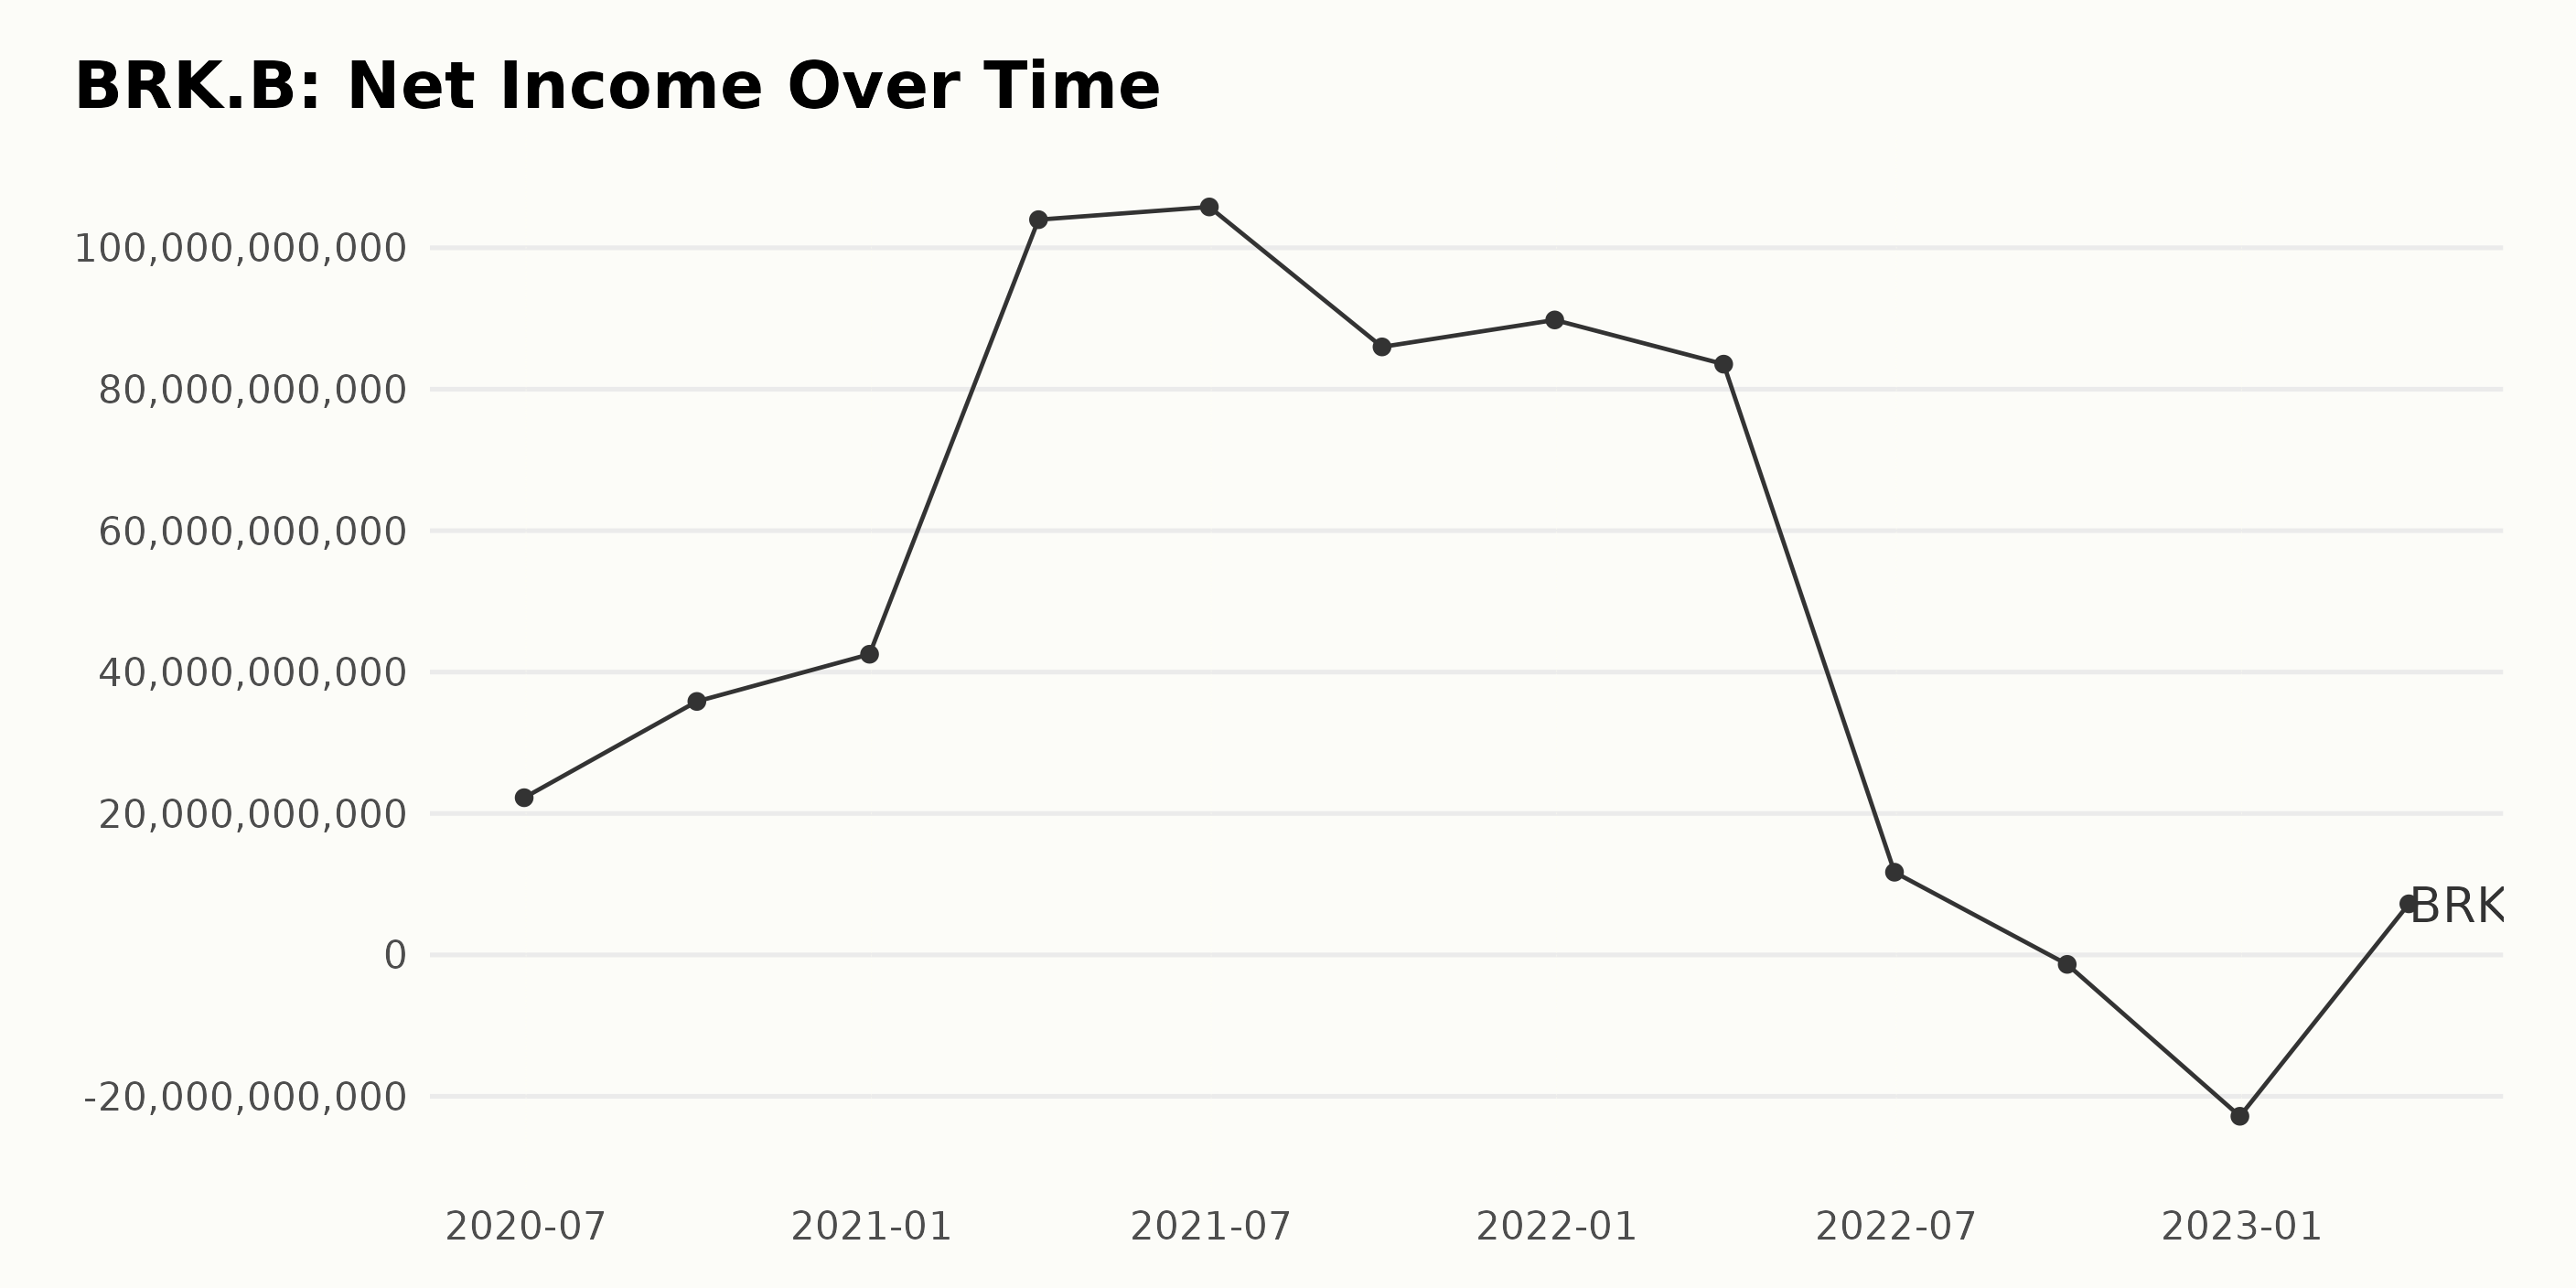
The trend and fluctuations of Berkshire Hathaway’s trailing-12-month net income are as follows:
On June 30, 2020, the net income was $22.23 billion; on September 30, 2020, the net income increased to $35.85 billion.
On December 31, 2020, the net income increased to $42.52 billion. On March 31, 2021, there was a significant jump in net income to $103.98 billion, while on June 30, 2021, net income marginally increased to $105.78 billion.
However, on September 30, 2021, net income decreased to $85.98 billion. On December 31, 2021, it slightly increased to $89.8 billion. On March 31, 2022, net income fell to $83.54 billion. On June 30, 2022, there was a significant drop in net income to $11.7 billion.
On September 30, 2022, net income declined further to -$1.34 billion, and on December 31, 2022, it dropped drastically to -$22.82 billion. Lastly, on March 31, 2023, net income recovered to $7.23 billion.
From these data points, we can observe some significant ups and downs in BRK.B’s net income. The most recent data point shows a recovery after a huge drop in the previous quarter. The growth rate between June 30, 2020, and March 31, 2023, is approximately -67.55%.
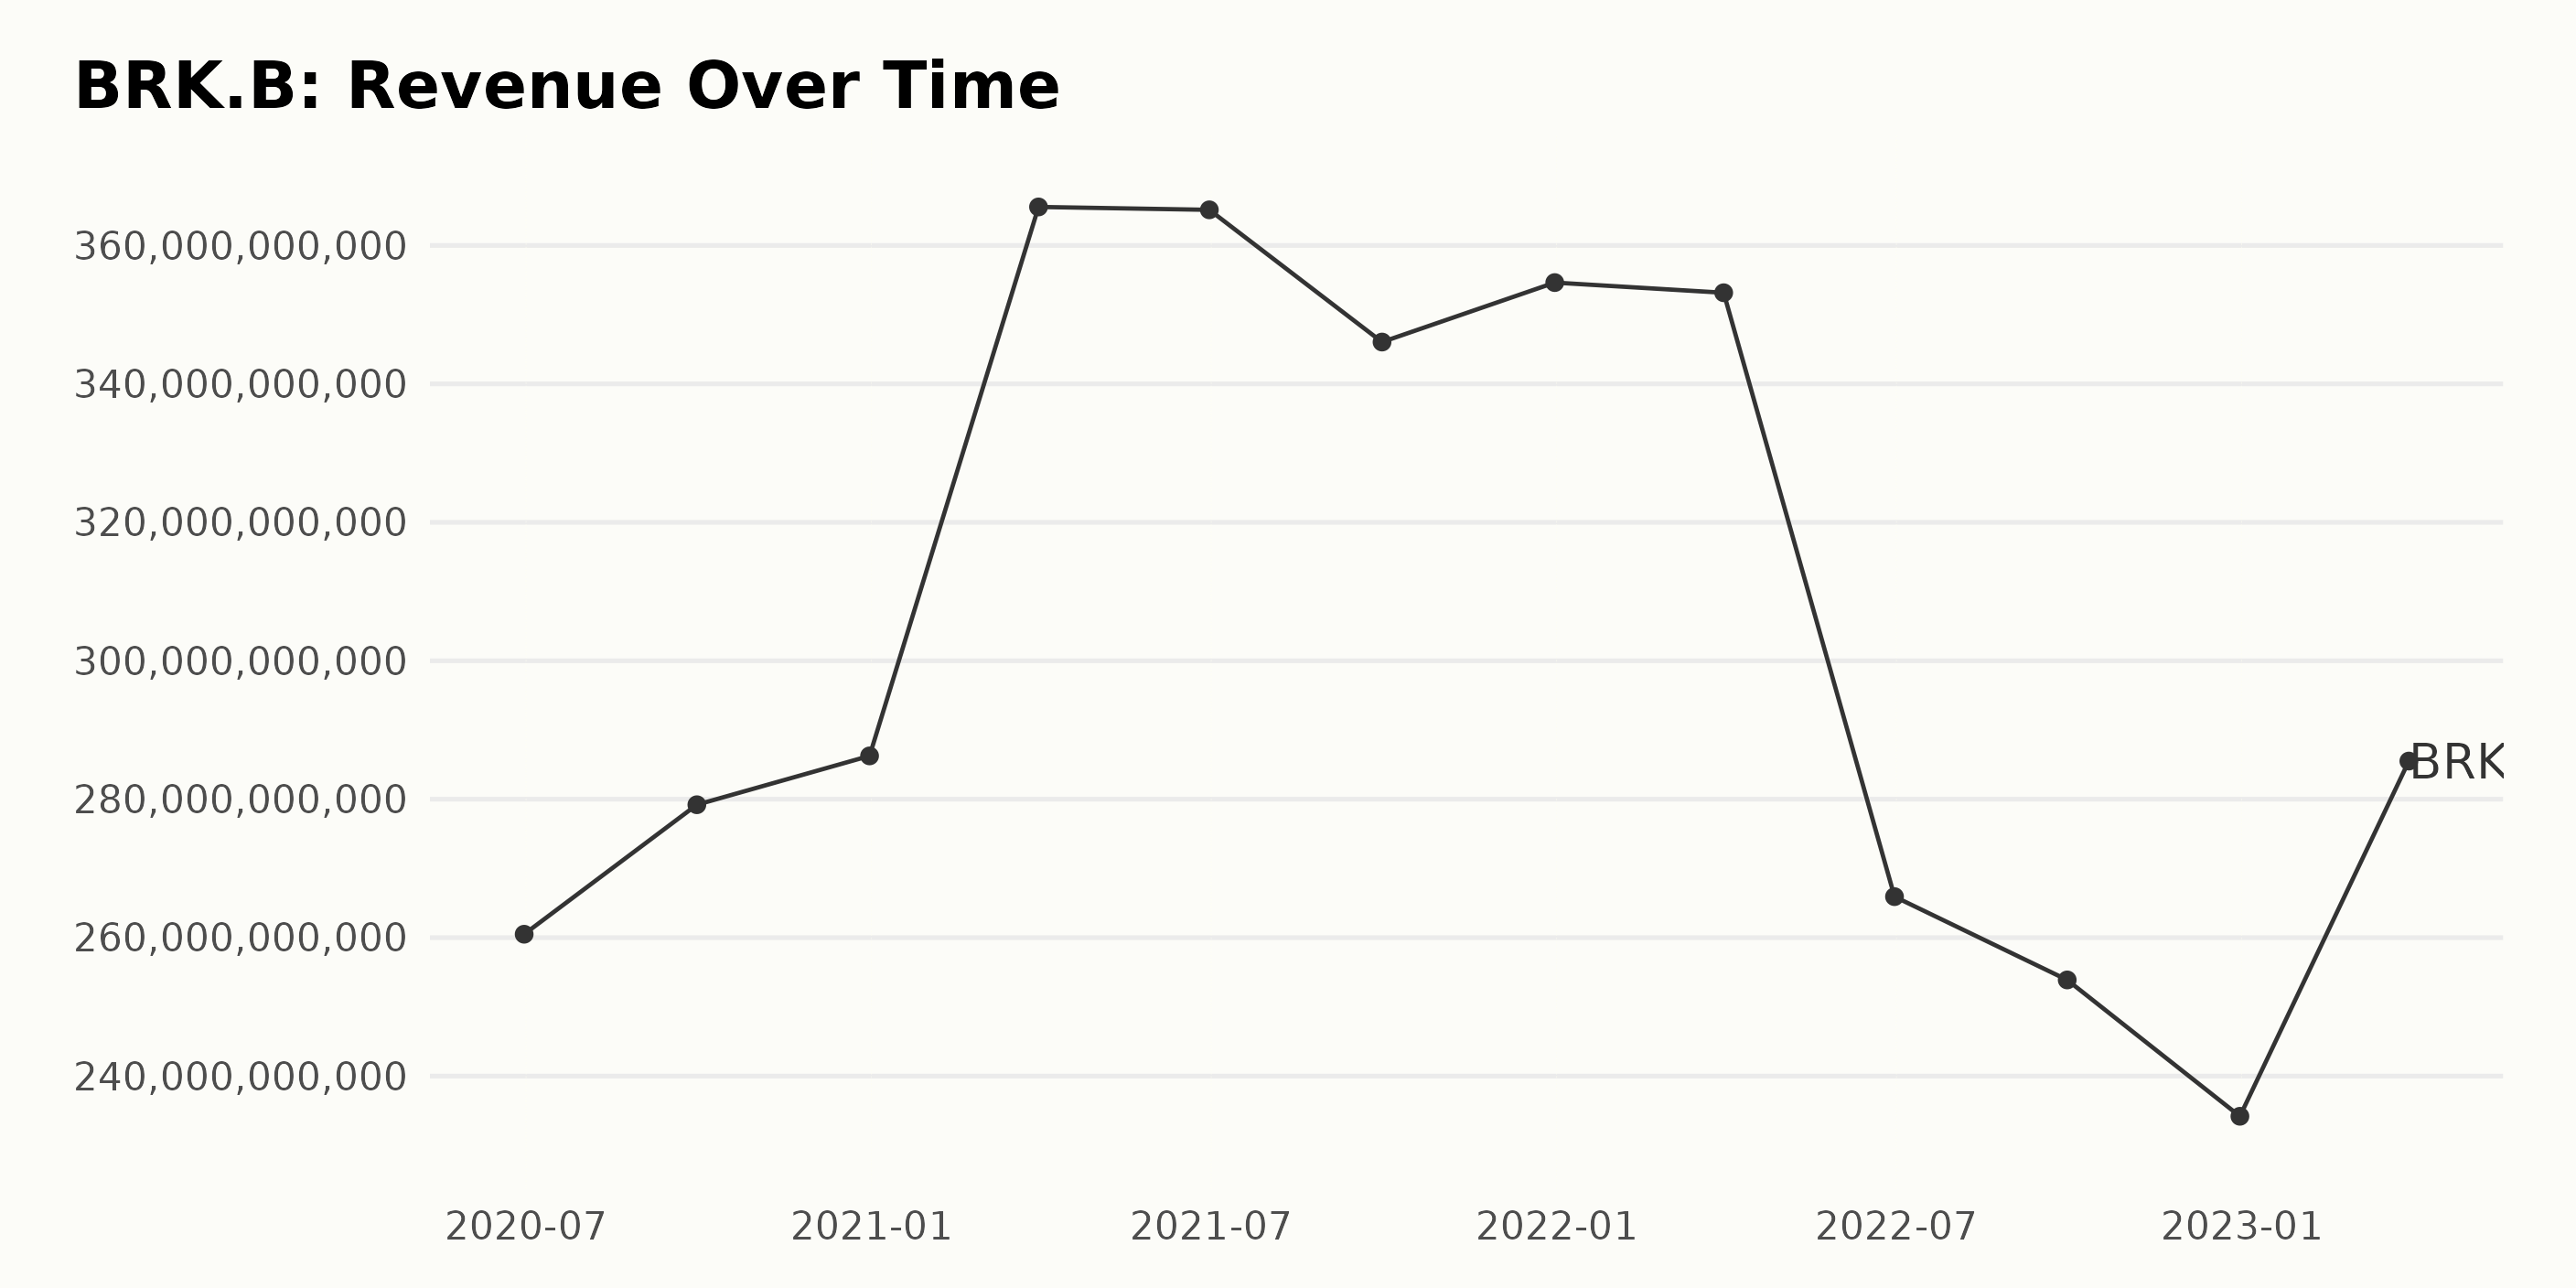
 The trailing-12-month revenue trend for BRK.B shows fluctuations over the given data series. Here are some highlights:
On June 30, 2020, the revenue was $260.49 billion, which increased to $279.20 billion by September 30, 2020, and continued to grow to $286.26 billion by December 31, 2020. A significant increase was observed by March 31, 2021, with revenue reaching $365.57 billion.
Revenue slightly decreased for the next two quarters: $365.15 billion by June 30, 2021, and $346.05 billion by September 30, 2021. The revenue picked up again in the last quarter of 2021, reaching $354.64 billion.
In 2022, revenue declined in all three quarters, amounting to $353.17 billion by March 31, $265.92 billion by June 30, and $253.89 billion by September 30. The revenue fell further to a low of $234.19 billion by December 31, 2022, but rebounded to $285.51 billion in the first quarter of 2023. The growth rate from June 2020 to March 2023 is approximately 9.6%. Recent data highlight a substantial increase in the first quarter of 2023 compared to the previous low by the end of 2022.
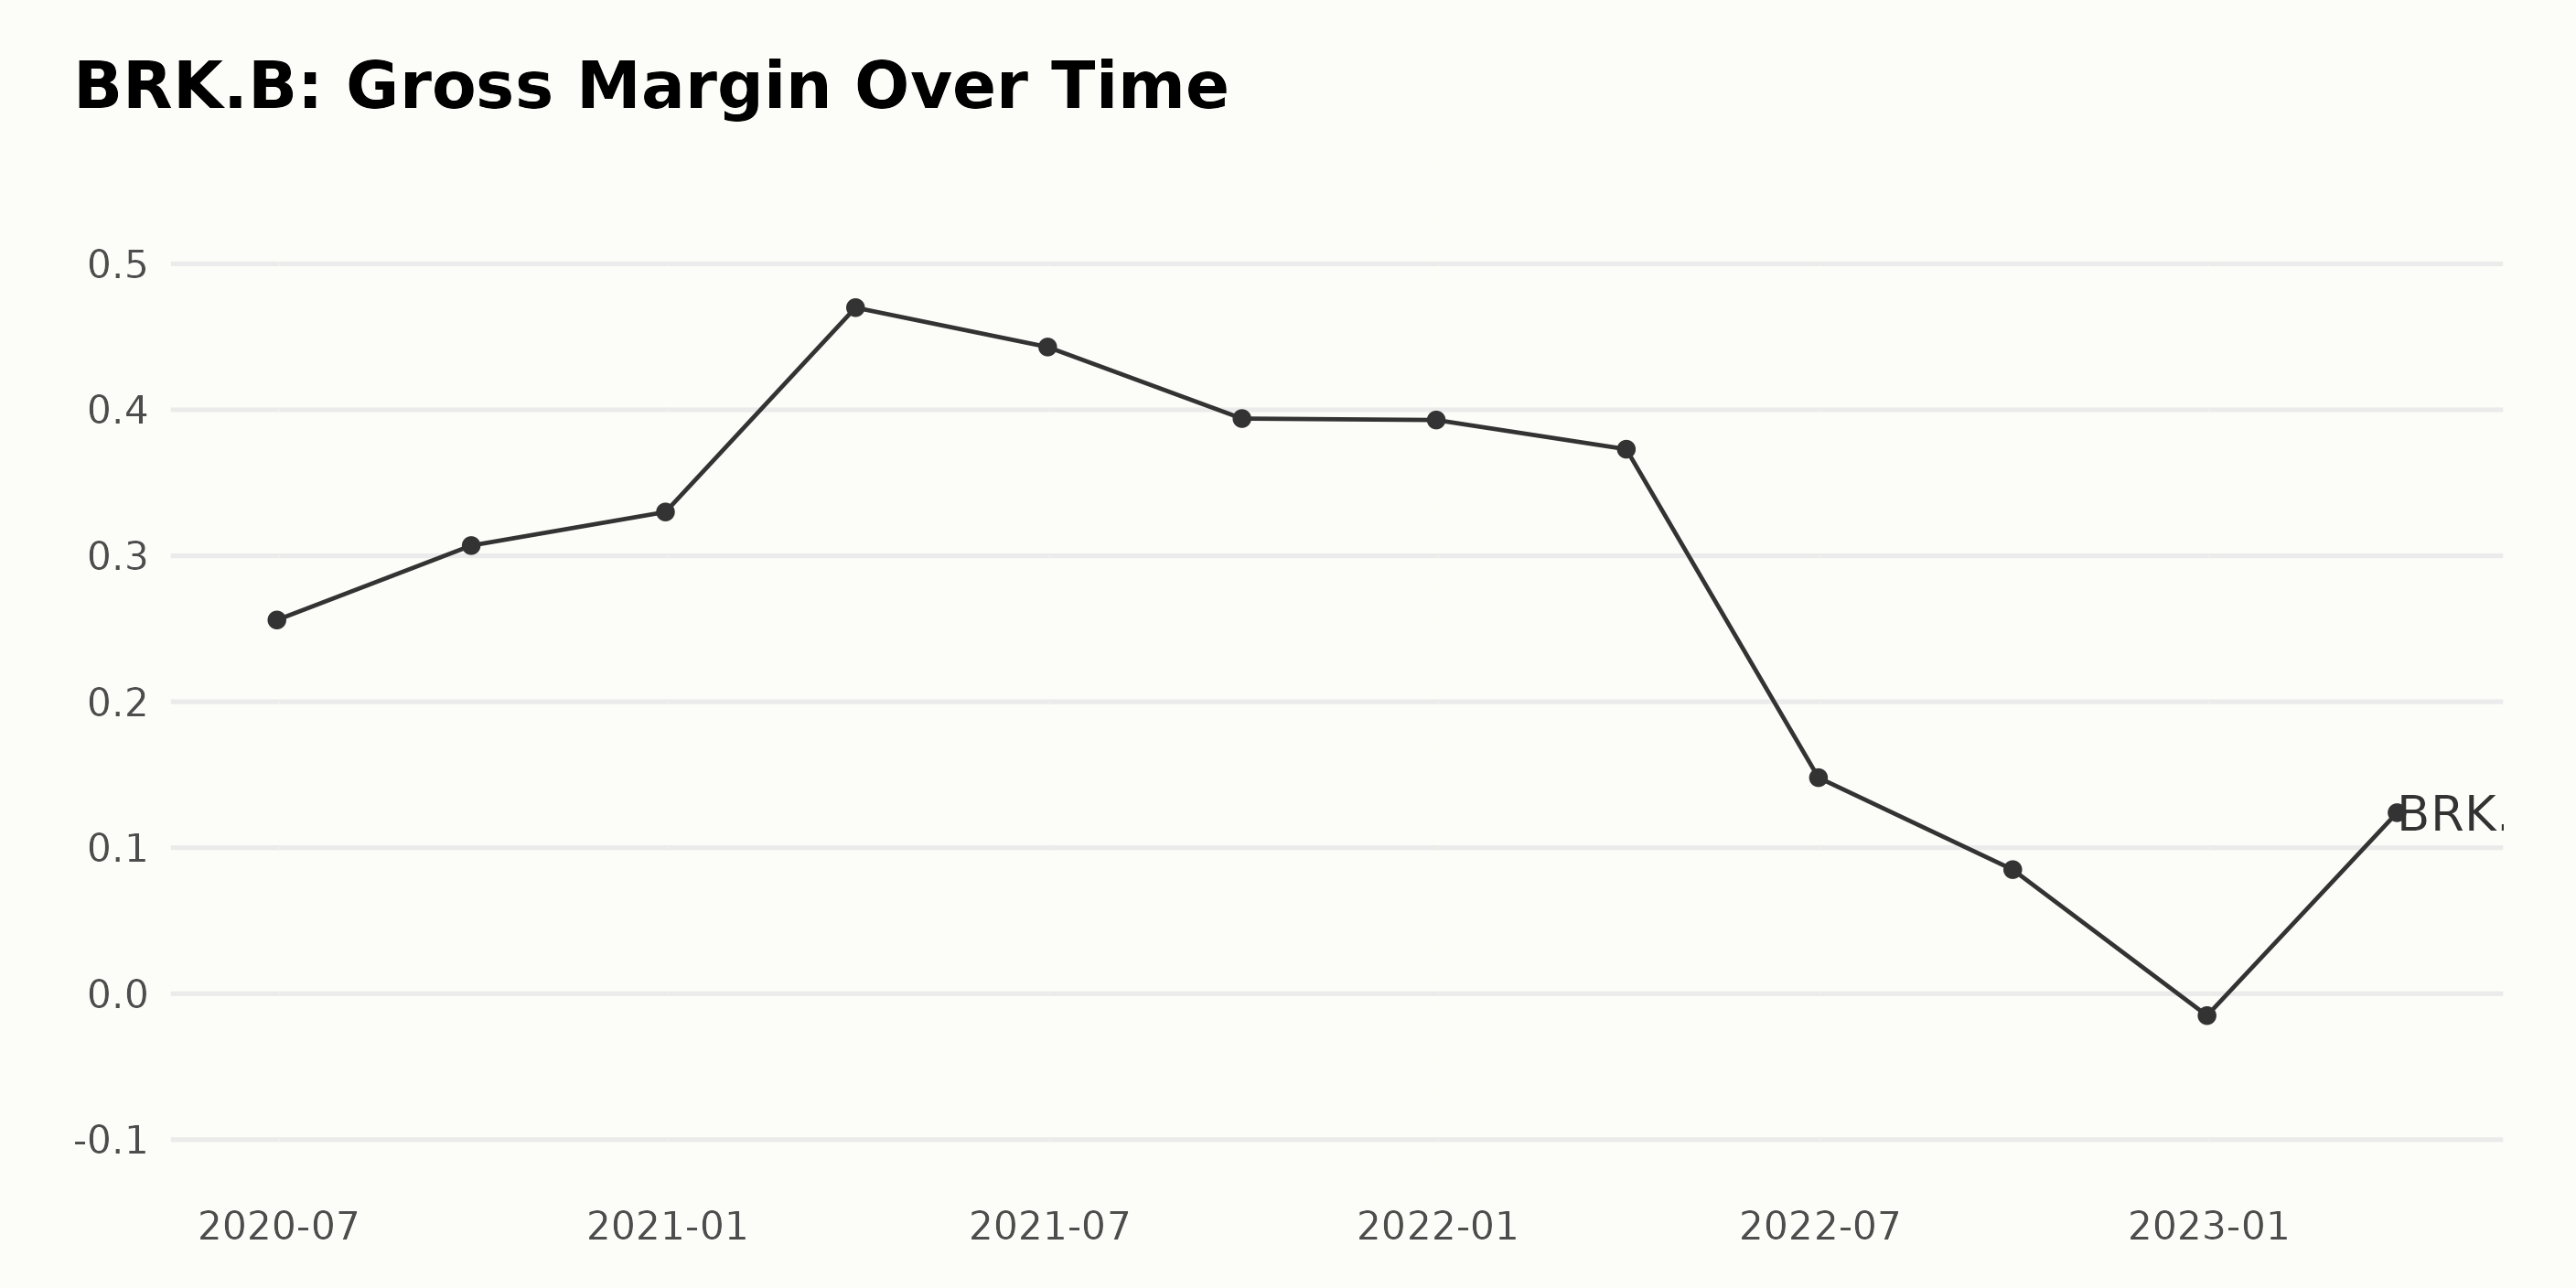
 The gross margin of BRK.B shows an overall fluctuating trend from June 2020 to March 2023. Here are the key points:
- Starting at 25.6% in June 2020, the gross margin increased to 30.7% by September 2020 and to 33.0% by December 2020.
- Significant growth was observed in March 2021, when the gross margin soared to 47.0%.
- It then declined to 44.3% by June 2021 but remained relatively stable at around 39% through September 2021 and December 2021.
- Subsequently, there was a substantial decline, reaching 14.8% by June 2022 and continuing to drop till it hit a negative value of -1.5% in December 2022.
- Finally, upward growth was observed, with the gross margin rebounding to 12.4% in March 2023.
Overall, the change between the first value (June 2020) and the last value (March 2023) in the series resulted in a growth rate of approximately -51.56%.
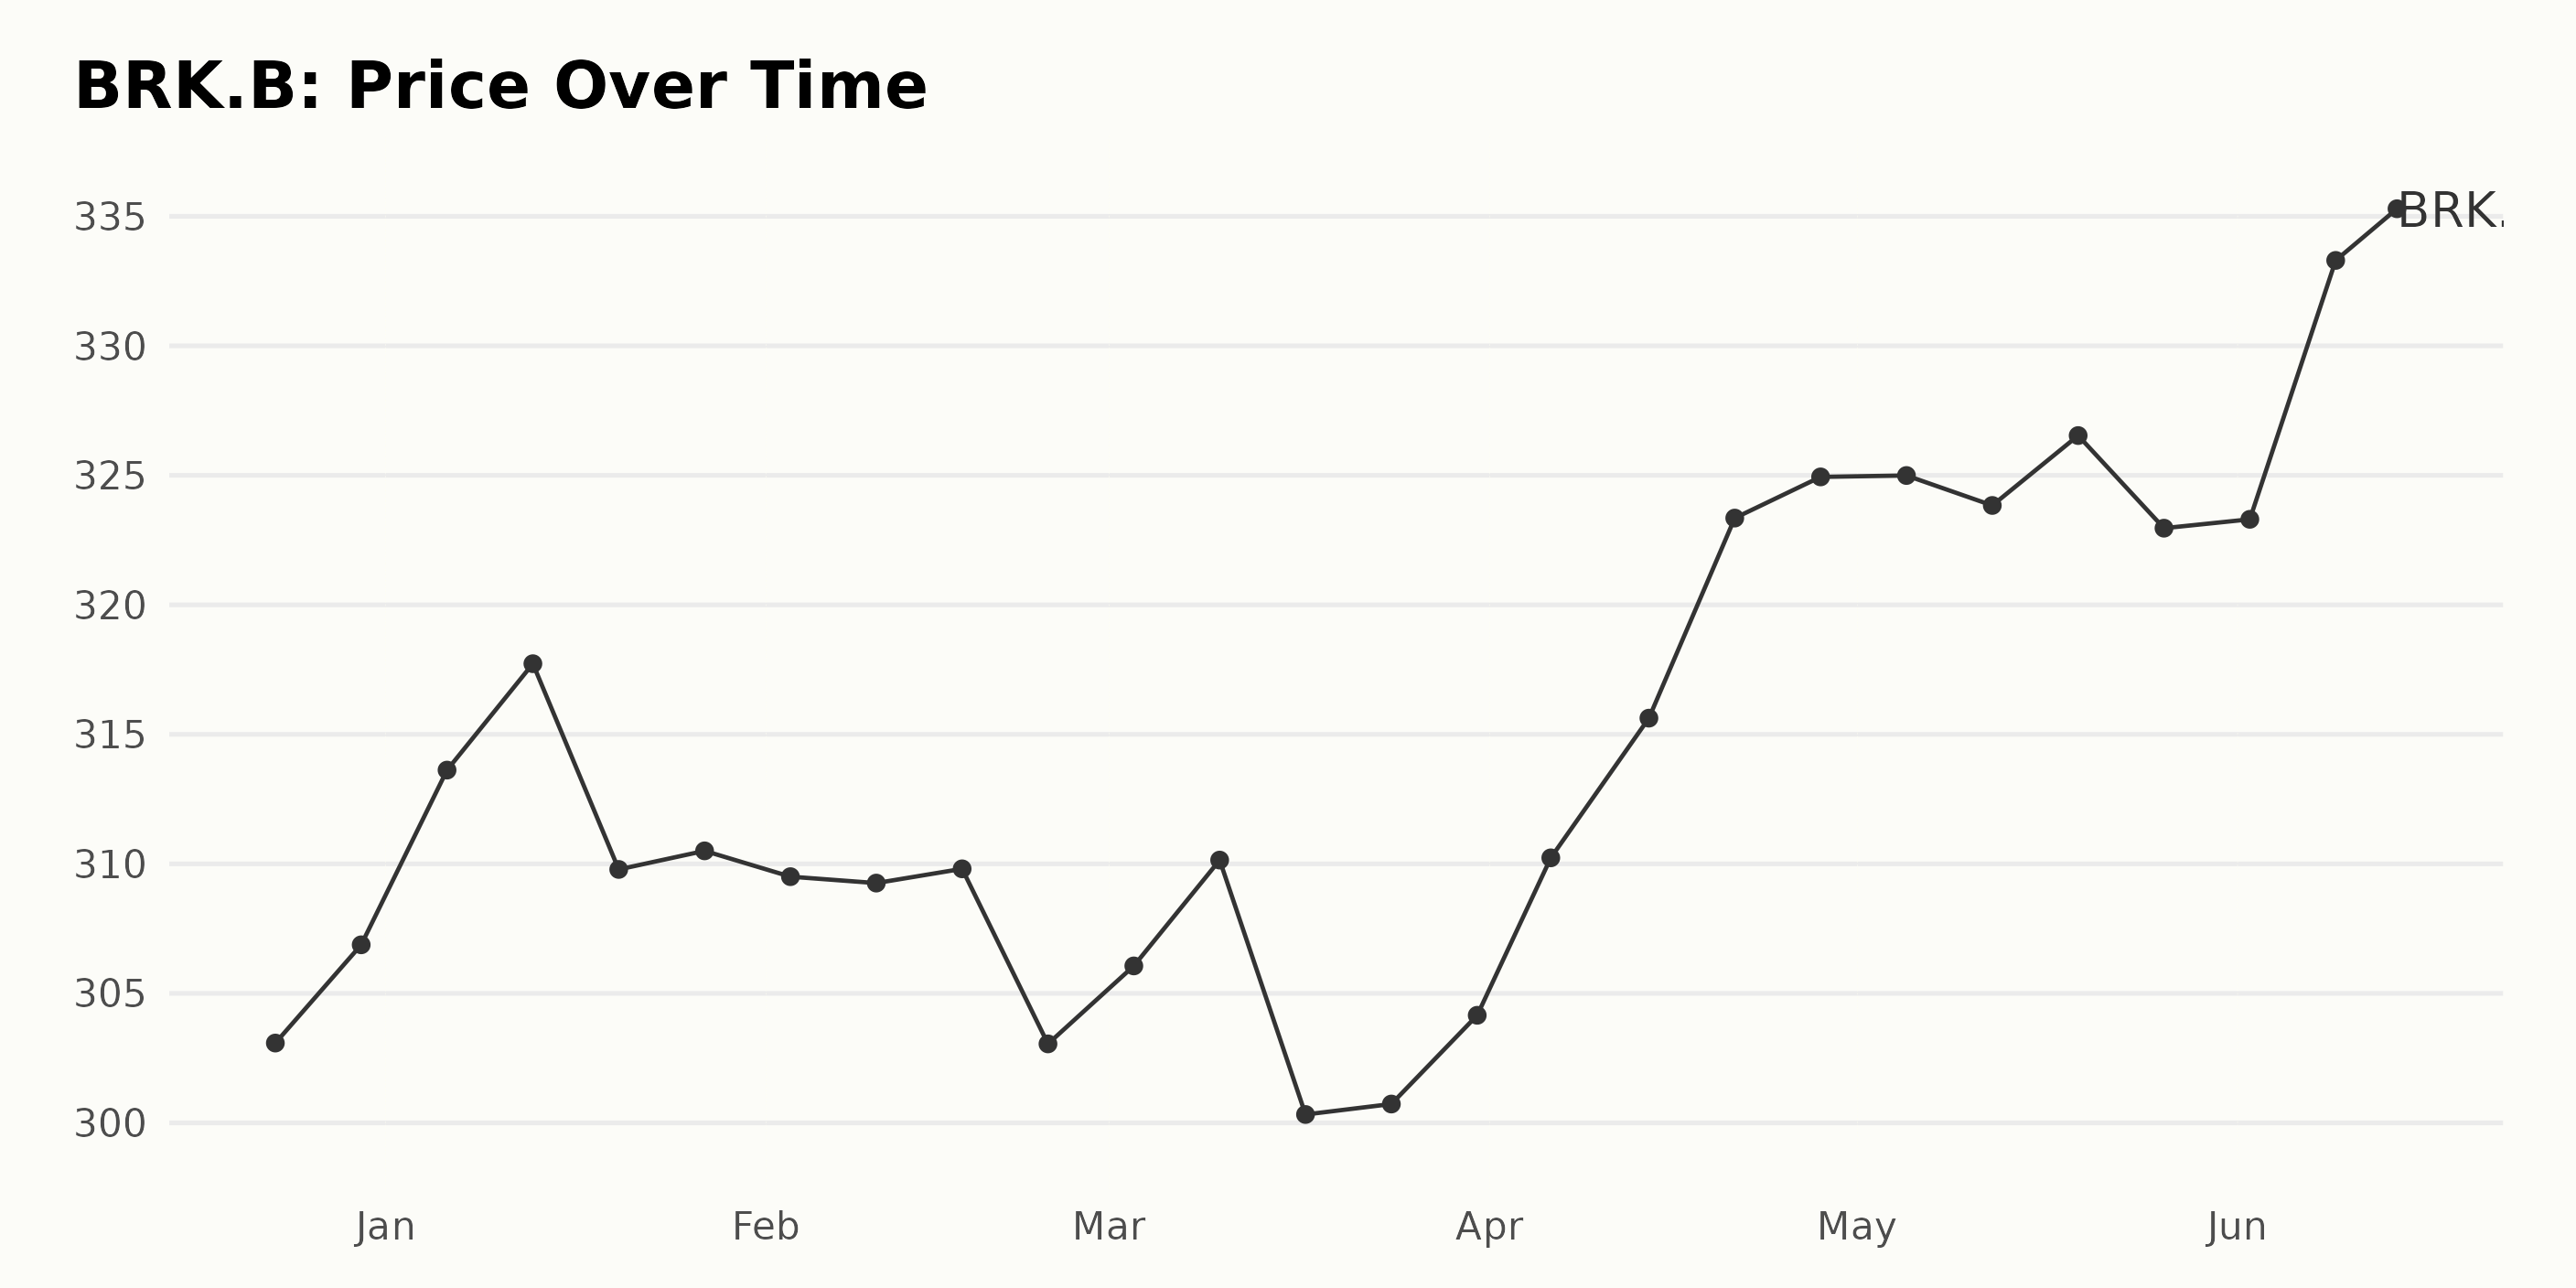
 Analyzing Berkshire Hathaway’s Share Price Trends and Growth Rates (Dec 2022 – Jun 2023)
The share price of BRK.B has generally been trending upward with slight fluctuations over the period from December 2022 to June 2023. The growth rate appears to accelerate during January, February, and June but decelerates at other times throughout this period. Here is a chart of BRK.B’s price over the past 180 days.
 Berkshire Hathaway POWR Ratings Show Uncertainty
BRK.B has an overall C rating, translating to a Neutral in our POWR Ratings system.
The POWR Ratings grade of BRK.B has remained constant at a grade of “C” over the past several months. Its rank in the Insurance - Property & Casualty category fluctuated throughout the period. Here are some key data points from the time frame:
Latest Value (as of June 14, 2023): It is ranked #34 out of the 56 stocks in the category. Some notable fluctuations in its rank during the given period are as follows:
- December 17, 2022: Rank 42
- January 28, 2023: Rank 43
- February 18, 2023: Rank 46
- May 20, 2023: Rank 36
- June 10, 2023: Rank 35
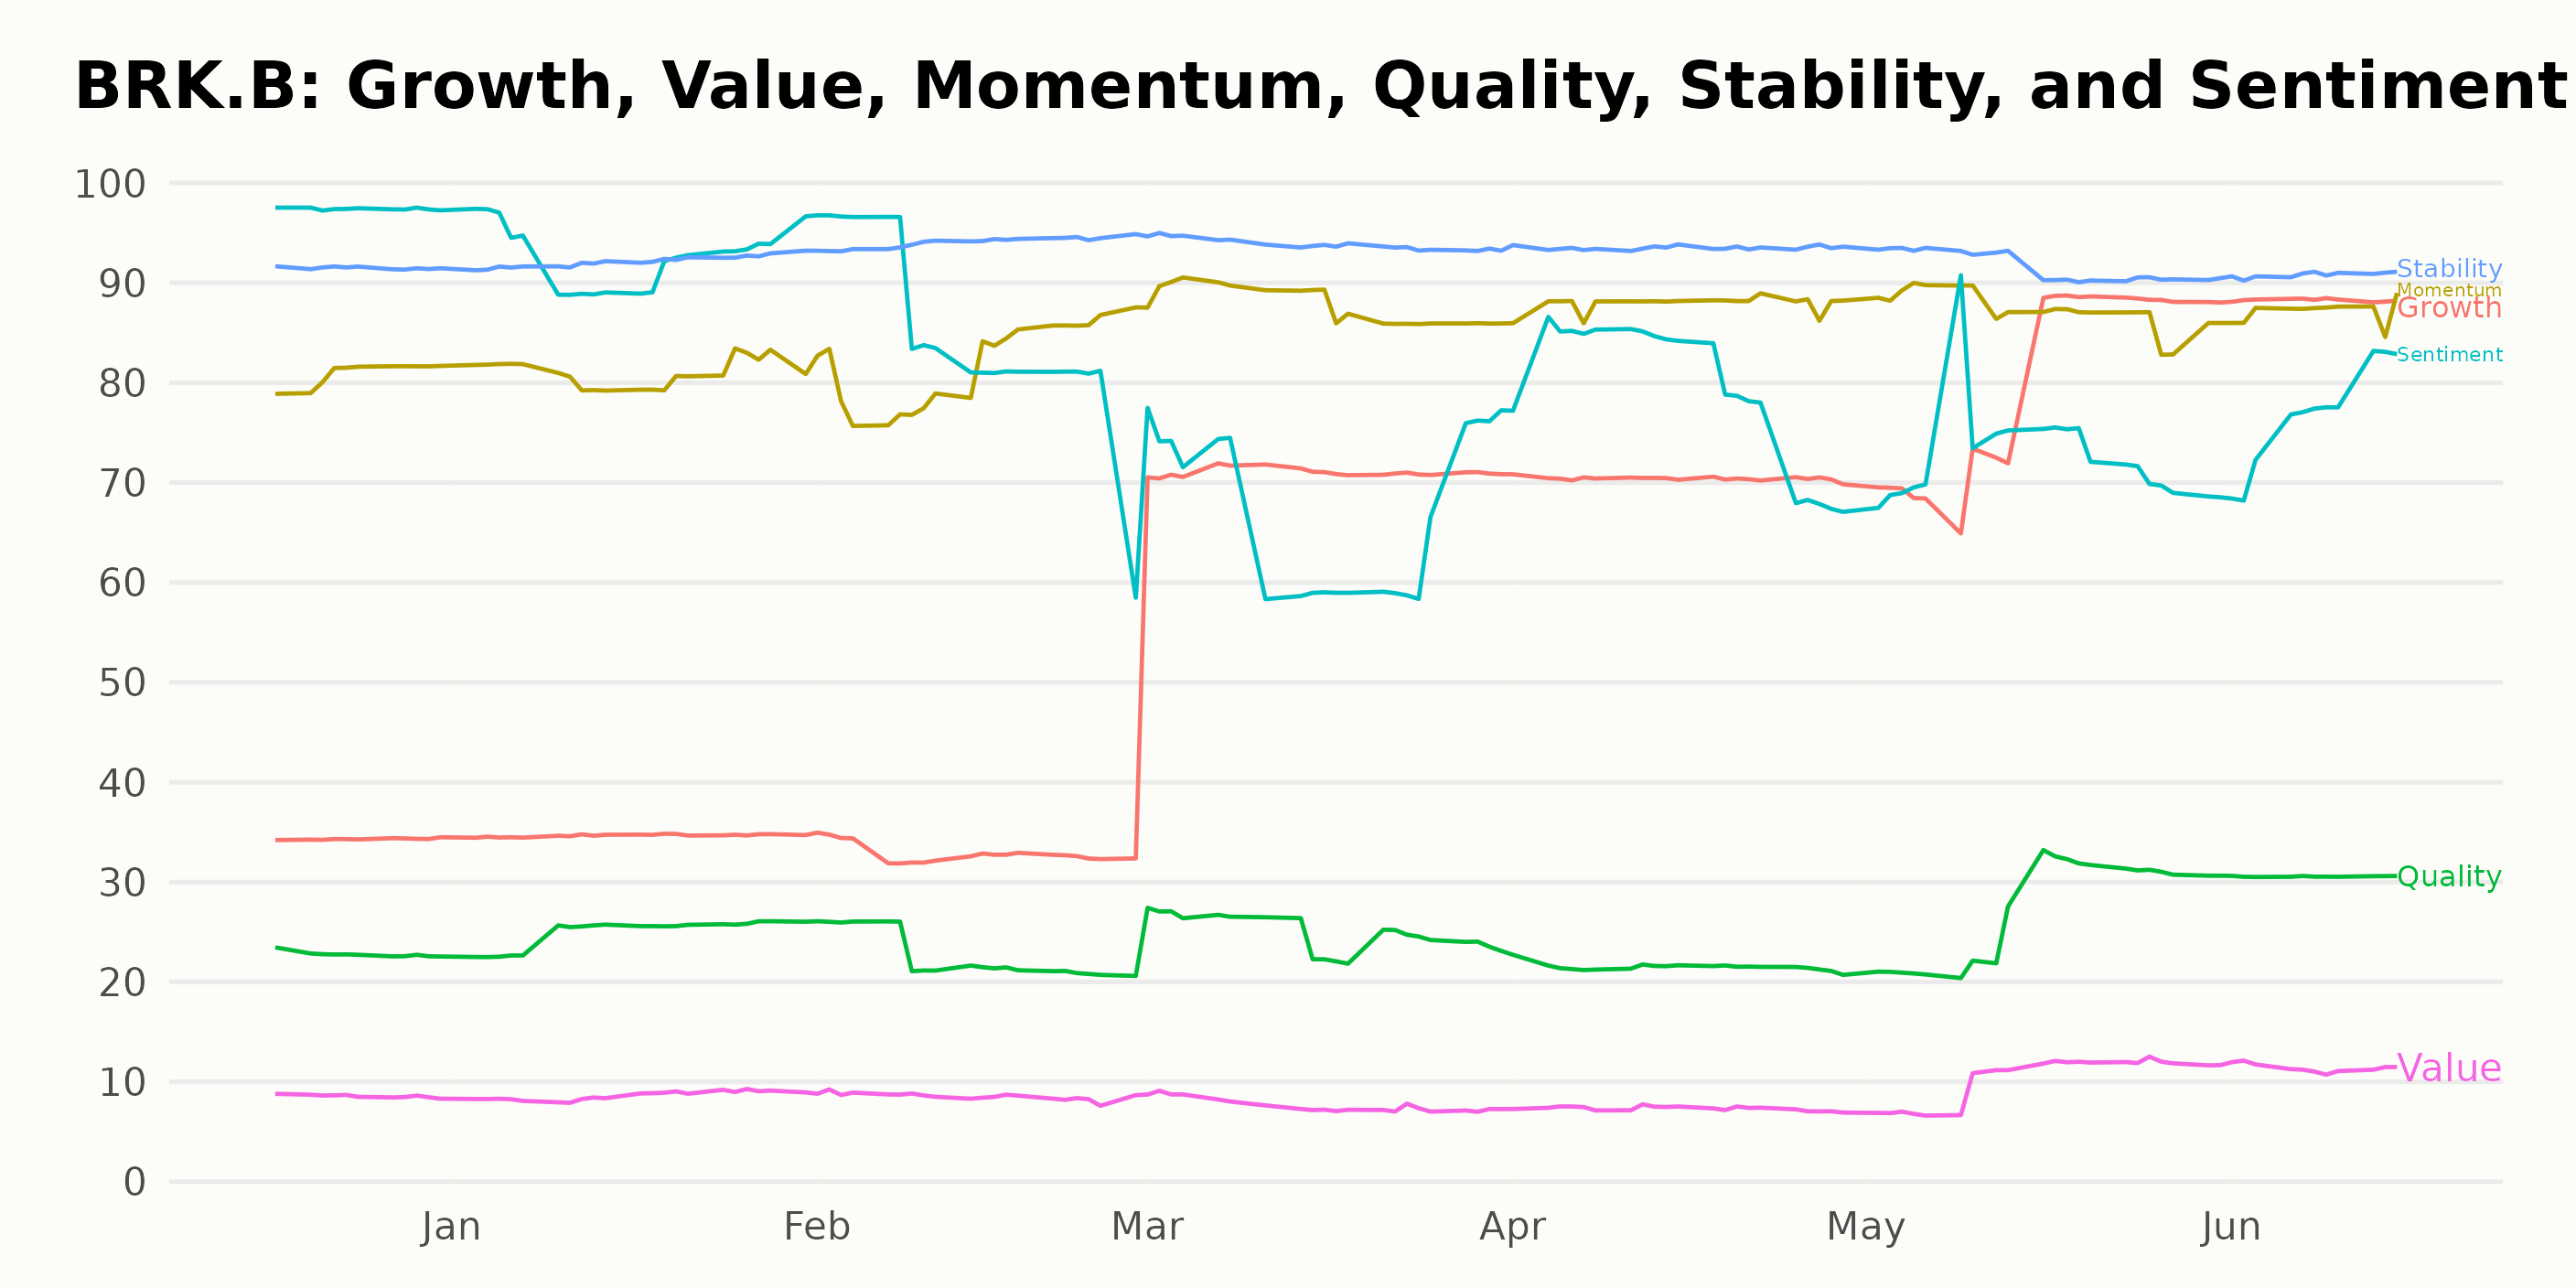
BRK.B has a D grade for Value and a C for Quality.
 How does Berkshire Hathaway Inc. (BRK.B) Stack Up Against its Peers?
Other stocks in the Insurance - Property & Casualty sector that may be worth considering are Heritage Insurance Holdings Inc. (HRTG), Fairfax Financial Holdings Ltd. (FRFHF), and UNIVERSAL INSURANCE HOLDINGS INC (UVE) -- they have better POWR Ratings.
What To Do Next?
Get your hands on this special report with 3 low priced companies with tremendous upside potential even in today’s volatile markets:
3 Stocks to DOUBLE This Year >
BRK.B shares were trading at $340.99 per share on Thursday afternoon, up $5.09 (+1.52%). Year-to-date, BRK.B has gained 10.39%, versus a 16.34% rise in the benchmark S&P 500 index during the same period.
About the Author: Subhasree Kar

Subhasree’s keen interest in financial instruments led her to pursue a career as an investment analyst. After earning a Master’s degree in Economics, she gained knowledge of equity research and portfolio management at Finlatics.
The post Should Investors Be Watching Berkshire Hathaway Inc. (BRK.B)? appeared first on StockNews.com