


Although Upstart Holdings, Inc. (UPST) experienced a downturn due to heightened inflation and recession fears last year, the stock has rebounded impressively with over 300% gain year-to-date. Benefiting from better-than-expected inflation readings and the growing optimism surrounding the potential halt of the Fed’s rate increases despite strong job growth, financial stocks, including UPST, have seen a recent uptick.
Moreover, UPST has garnered significant investor attention with its AI-driven lending marketplace in this AI-hyped era and the news of securing multiple long-term funding agreements. However, it should be noted that Upstart Holdings is currently operating at a loss.
In terms of market activity, UPST has observed a sharp increase in short interest, which suggests a heightened probability of a short squeeze ahead of its second-quarter earnings release. UPST has a short interest of 26.88 million and a short float of 38.40%.
So, I think UPST is not a wise choice for risk-averse investors. Below are some of its key metrics that support the bearish stance.
Analyzing UPST’s Financial Performance: Trends and Fluctuations (2020-2023)
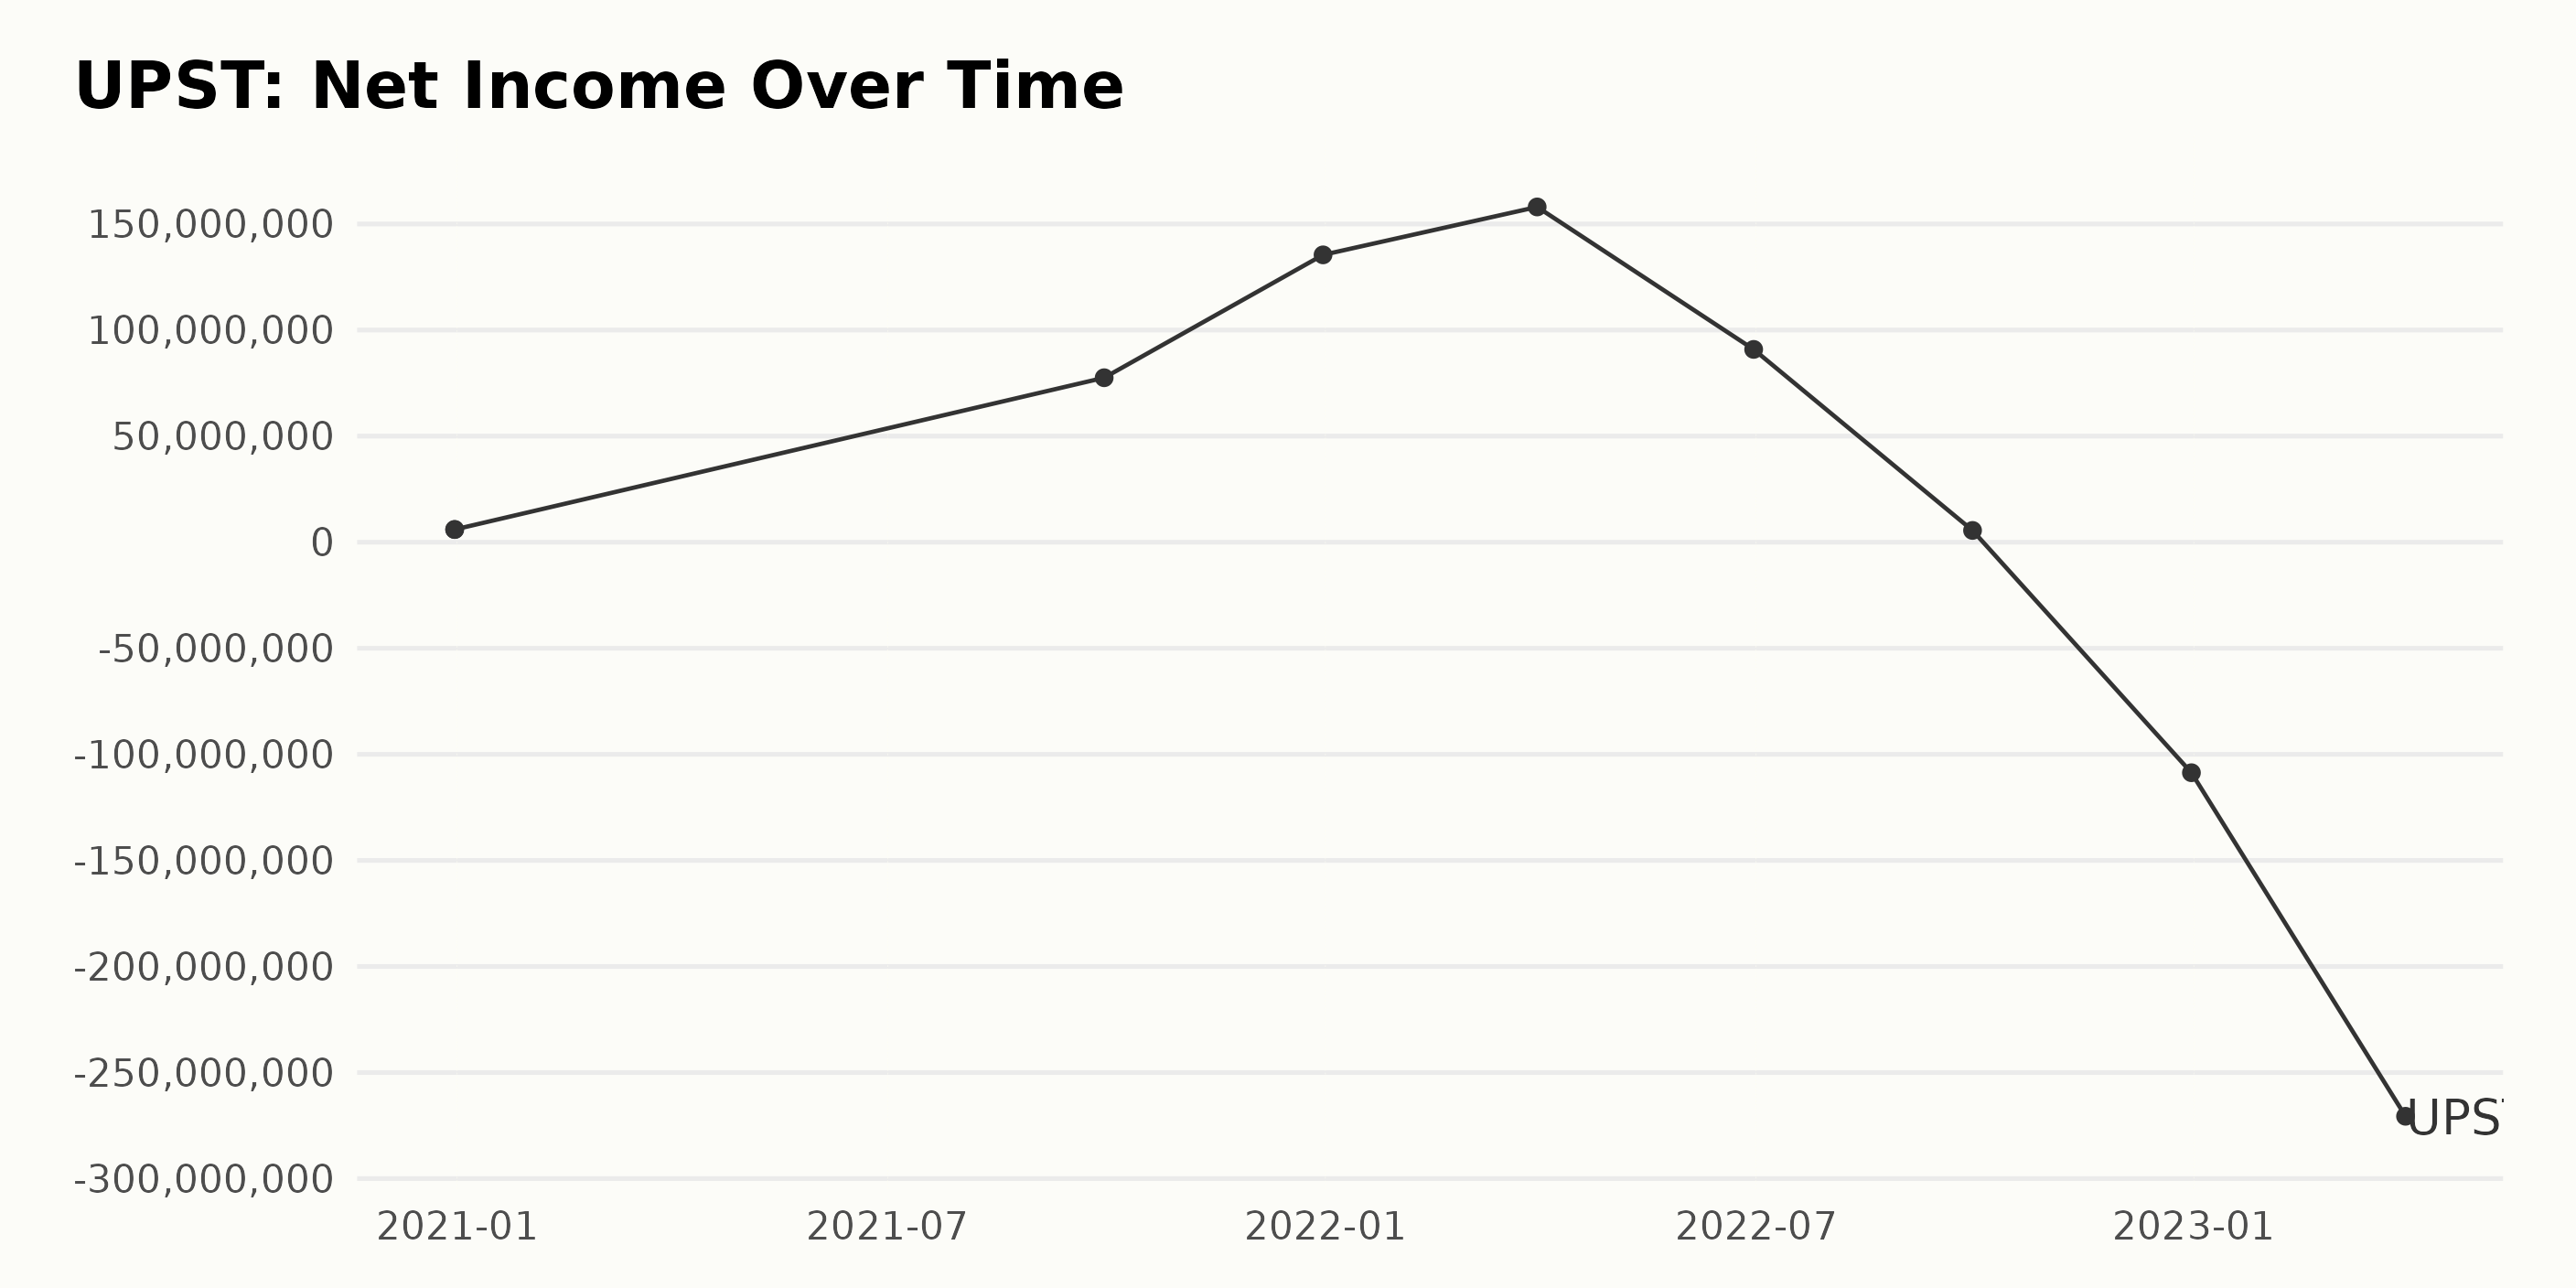
The trailing-12-month net income performance of UPST throughout this series of data exhibits considerable fluctuations. Here is a summarized view of the trend:
- At the start of the timeline on December 31, 2020, the net income of UPST was reported as $5.98 million.
- Following a similar pattern in the succeeding quarter with a net income of $5.98 million, the net income experienced a remarkable increase to $77.52 million as of September 30, 2021, signifying an upward trend in the series.
- In the subsequent quarter of December 31, 2021, a pronounced positive growth was visible as the net income soared high to $135.44 million. Moreover, it continued its upward trajectory until March 31, 2022, crossing the benchmark to $158.03 million.
- However, the succeeding quarters saw a downward shift in the trend. As of June 30, 2022, the net income fell to $90.88 million, followed by a significant drop to $5.54 million on September 30, 2022.
- Marked by the end of 2022, UPST showed a negative net income of $108.66 million on December 31, creating a sharp decline in the graph.
- The last value in this time series showcases further deterioration, with a negative figure of $270.61 million at the end of the first quarter in 2023.
Considering the series’s first and last value, it can be evaluated that UPST’s net income underwent a negative growth rate, moving from a positive figure of $5.98 million in 2020 to an apparent deficit of $270.61 million in 2023. This indicates substantial volatility in the financial performance of UPST within the mentioned timeframe.
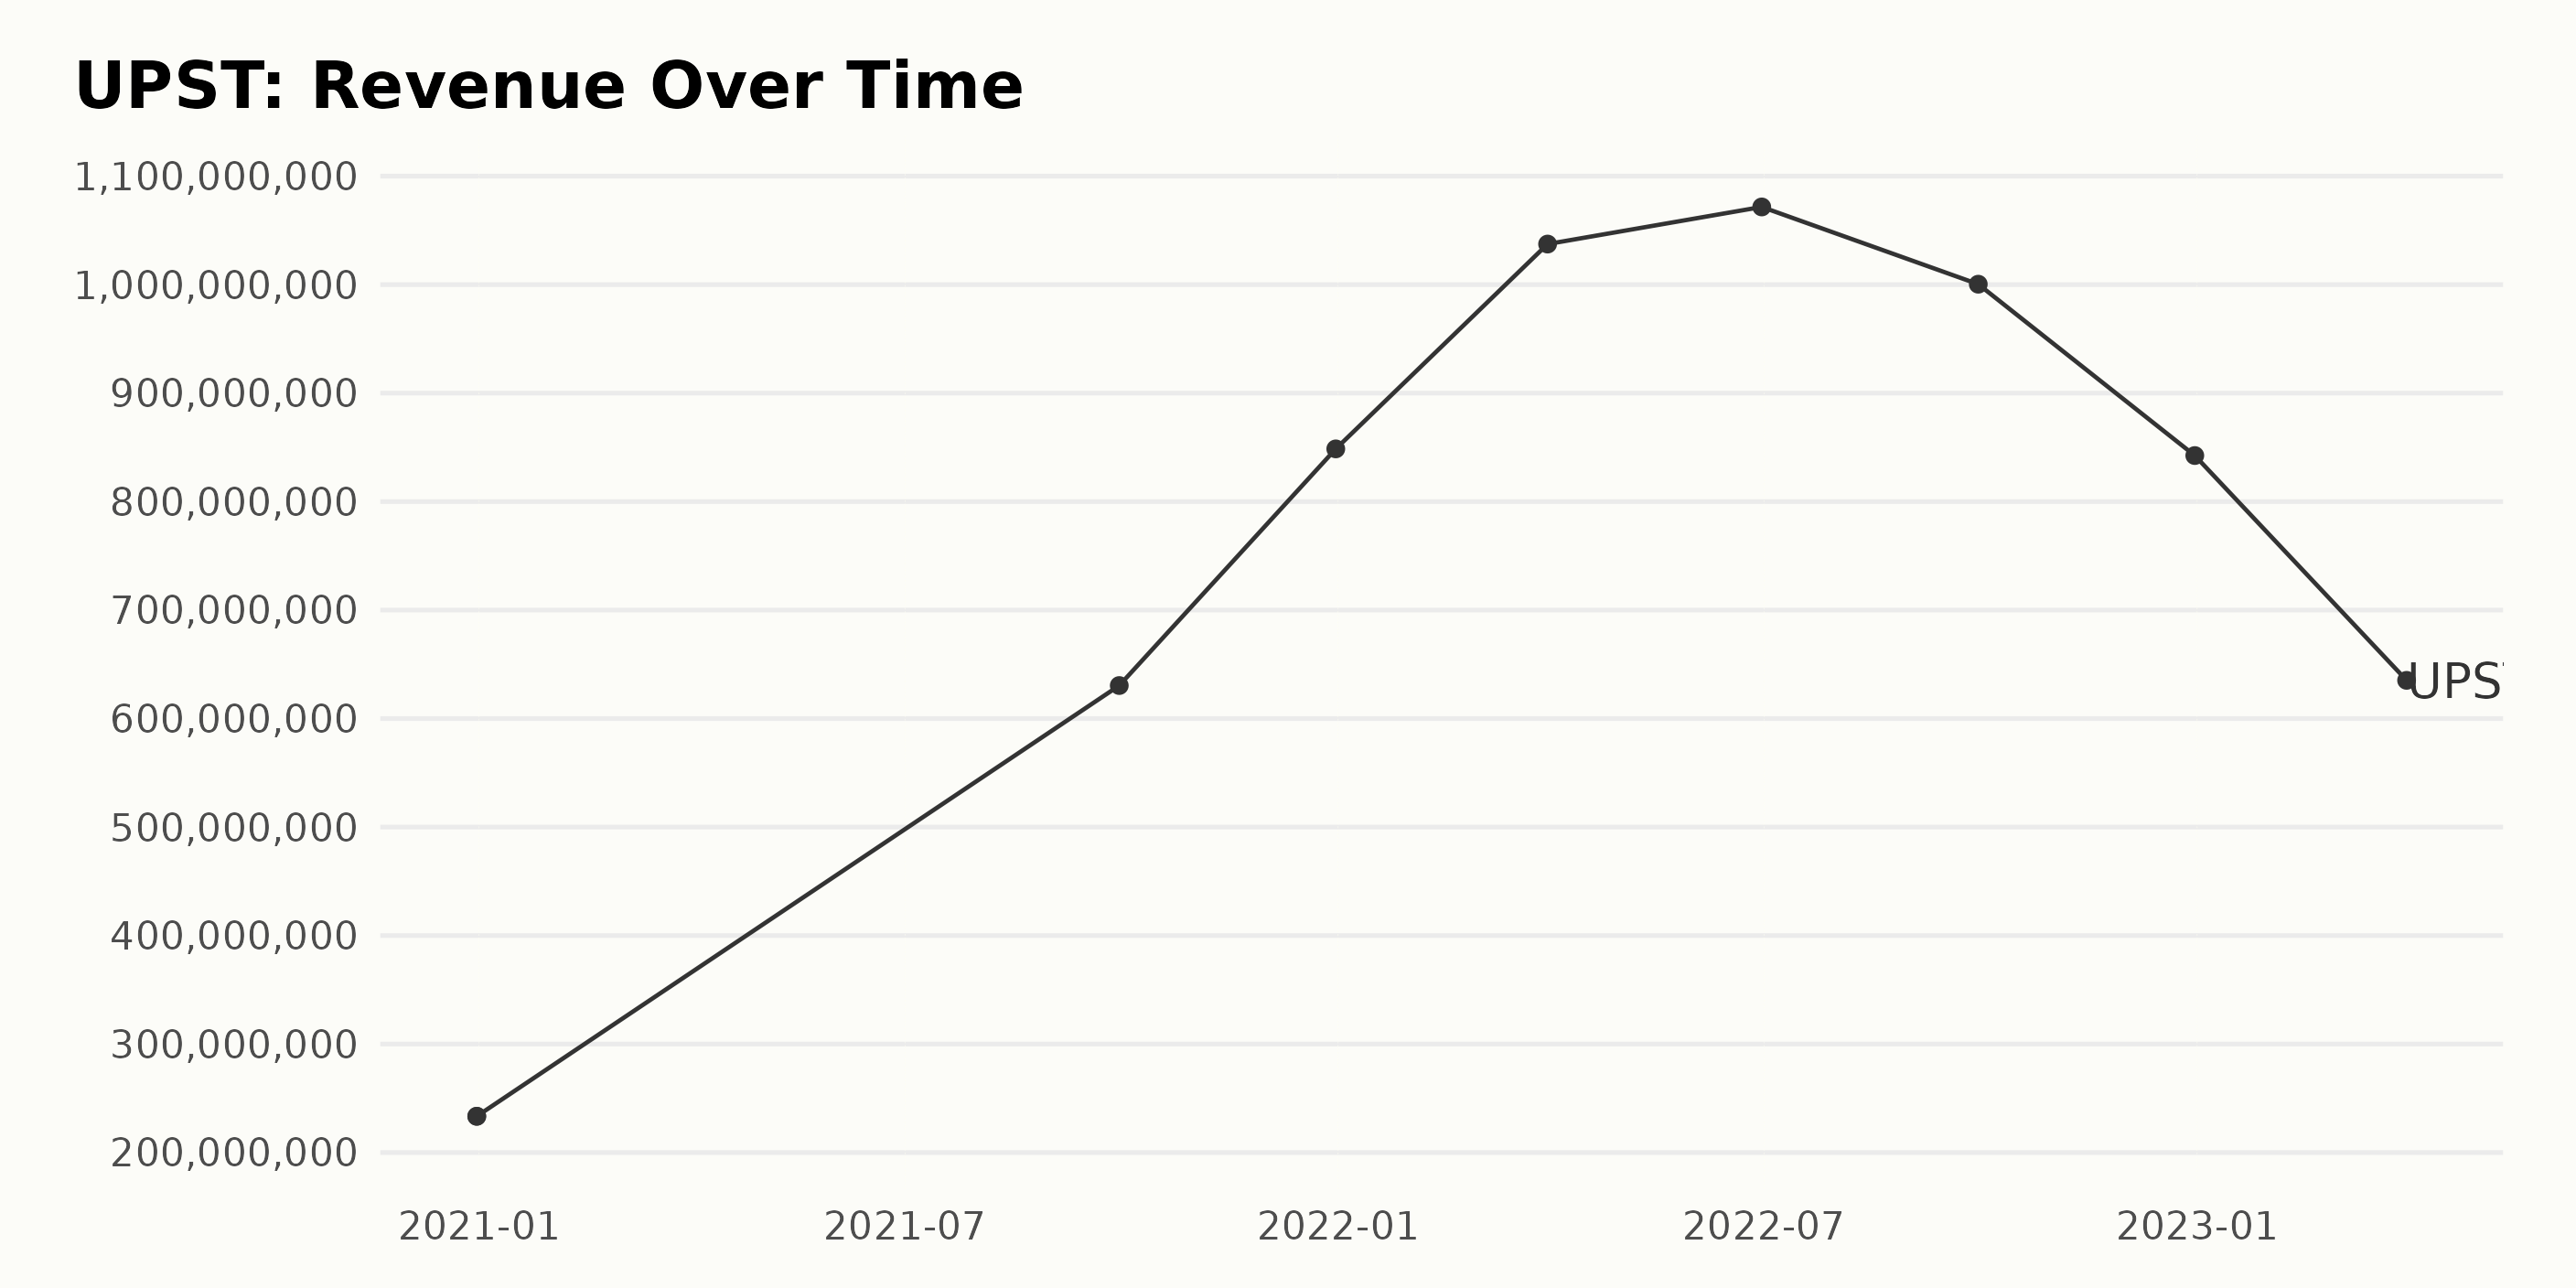
The trend and fluctuations in the trailing-12-month revenue over the given period can be summarized as follows:
- From December 31, 2020, to December 31, 2021, UPSTreported a significant increase in its revenue, from $233.42 million to $848.59 million.
- This steady growth continued into early 2022, with the company’s revenue swelling to $1.07 billion by June 30.
- A sharper decrease occurred towards the end of the year, where on December 31, 2022, UPSTreported revenue of $842.44 million, indicating a decline in its performance.
- The downtrend continued into the first quarter of 2023, with the revenue further decreasing to $635.24 million as of March 31, 2023.
Calculating the growth rate by measuring the last value from the first value, we note an approximately 172% increase in revenue from the $233.42 million recorded in December 2020 to the $635.24 million reported in March 2023. However, a greater emphasis is put on the later data sets, where a clear downward trend can be observed. The company experienced its peak revenue in mid-2022 before experiencing a continuous decline till March 2023. Consequently, the firm should closely monitor this declining trend to place timely interventions and maintain its financial health.
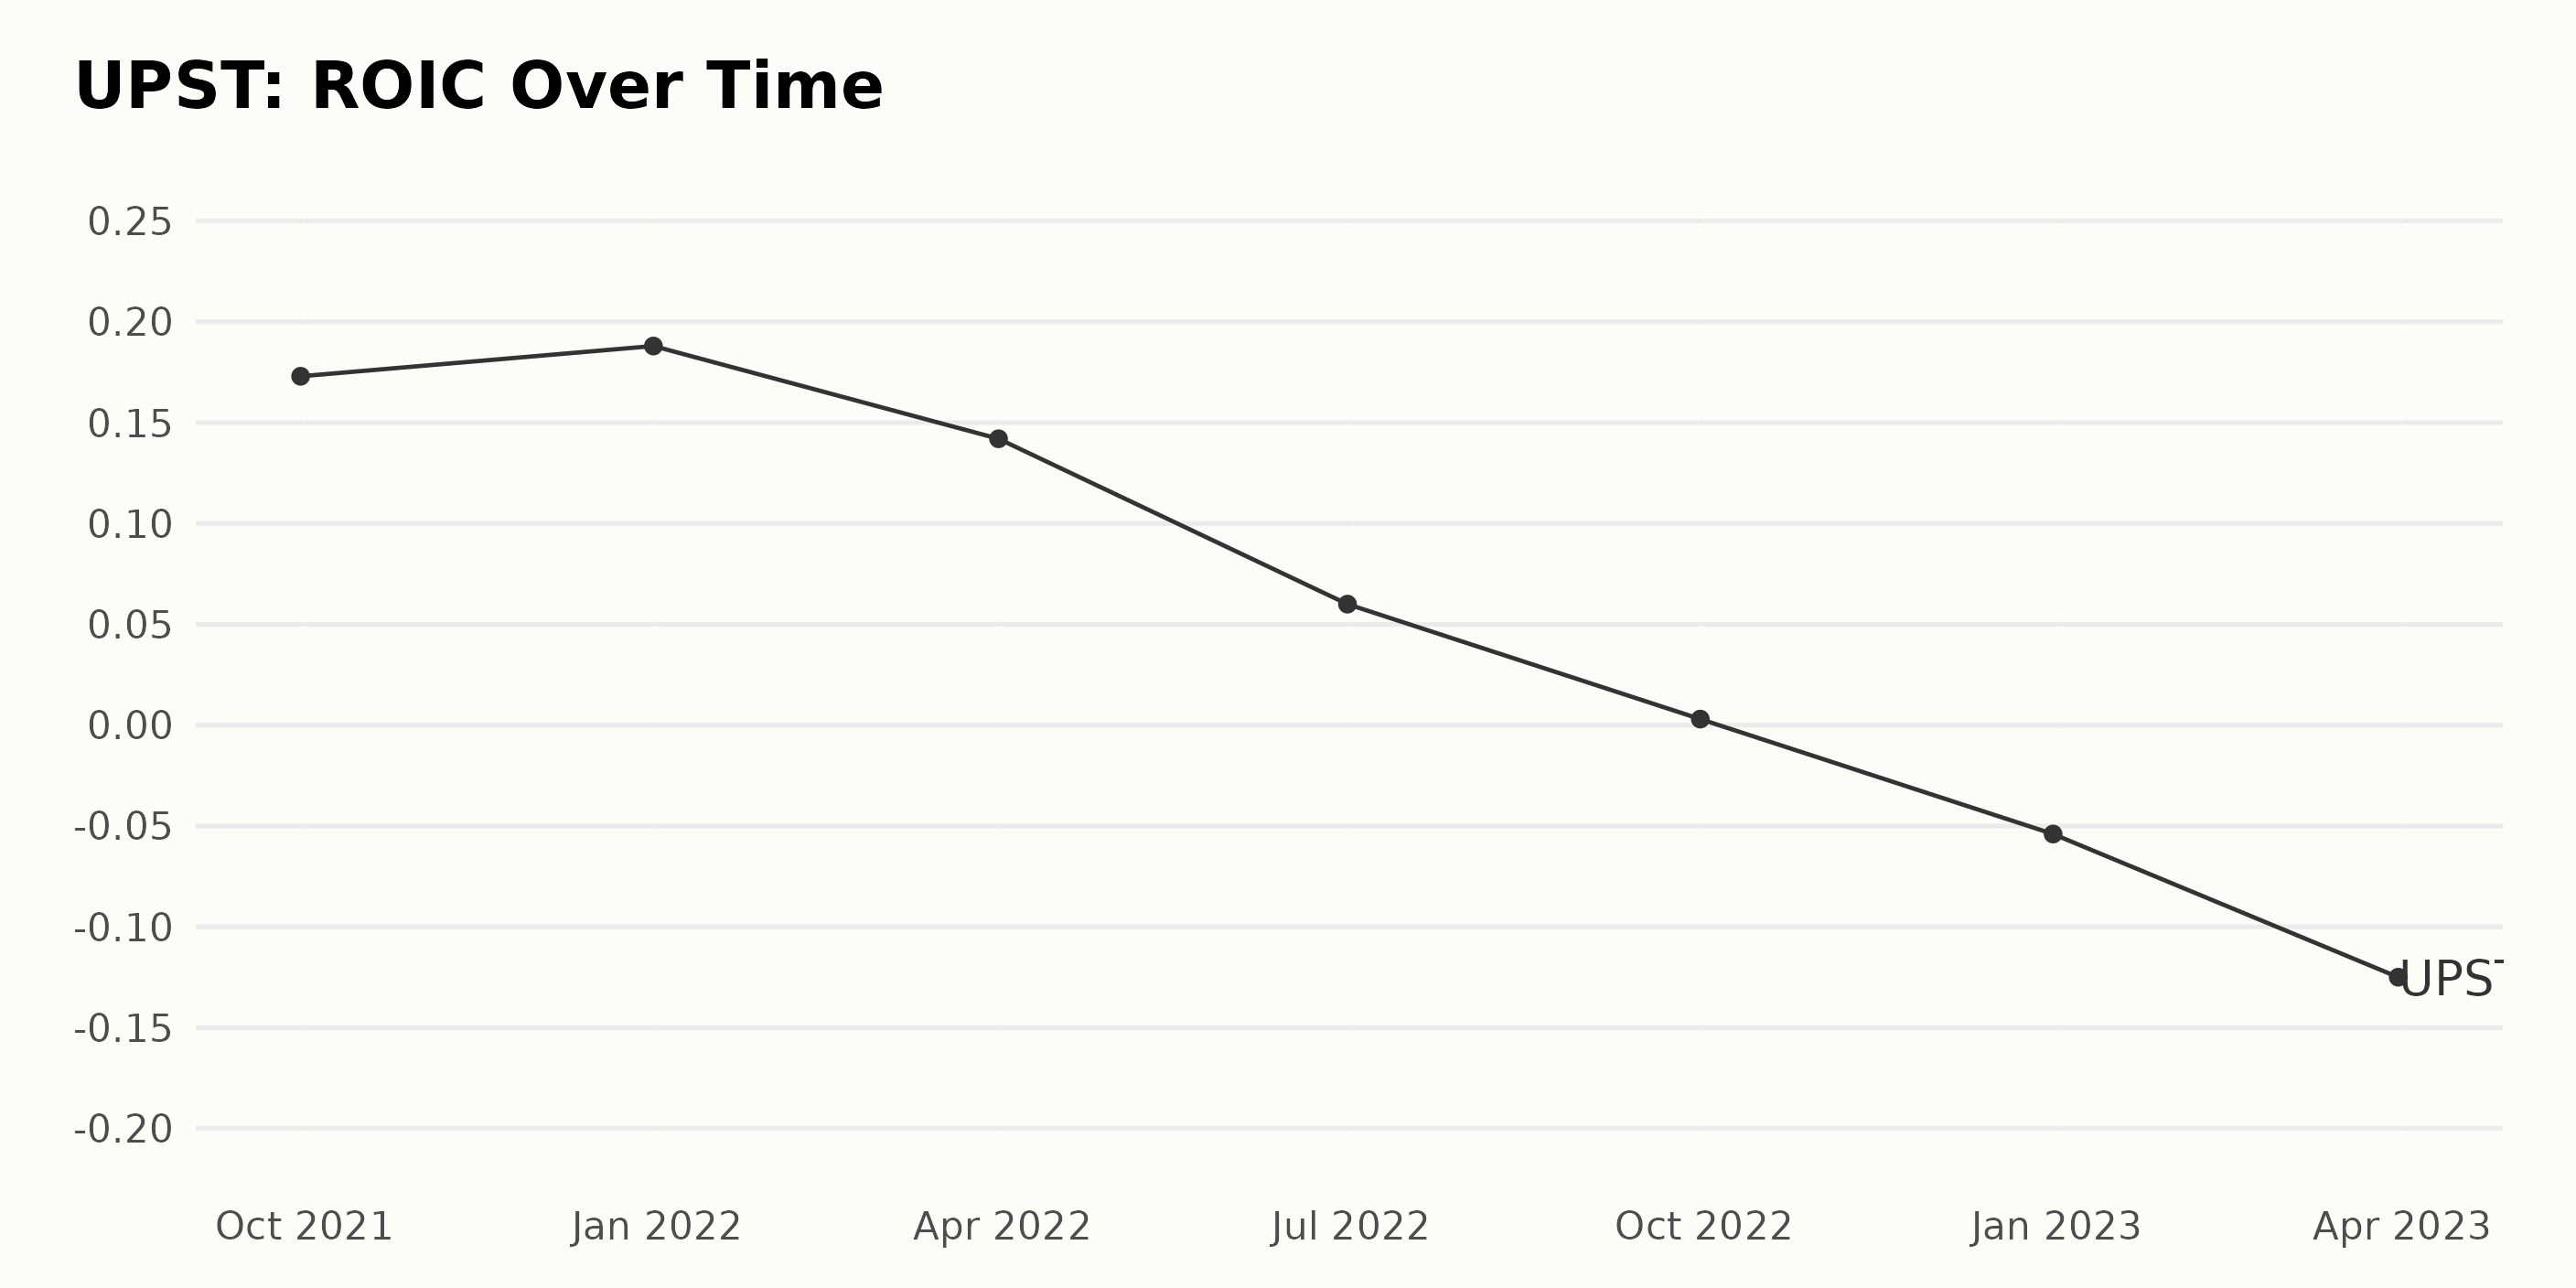
The data shows the fluctuating trend of Return on Invested Capital (ROIC) for UPST from September 2021 to March 2023.
- The ROIC initially displayed a minor growth from 0.173 in September 2021 to 0.188 in December 2021.
- After this slight rise, there was a significant drop to 0.142 at the end of the first quarter of 2022.
- The continued downward trend is apparent as the value fell drastically to just 0.06 by June 2022.
- This trend was exacerbated over the next quarters as the ROIC tumbled to the lowest value of -0.125 in March 2023.
Therefore, from September 2021 to March 2023, UPST’s ROIC demonstrated a steep decline. Also, a negative growth rate was calculated between the first and last values, indicating a worsening financial performance.
It’s noteworthy that larger fluctuations were observed in more recent times. Contrary indications in the data should be scrutinized, as the most recent one indicates a steeper negative downturn. So, more recent trends suggest increased volatility and downward pressure on UPST’s financial performance.
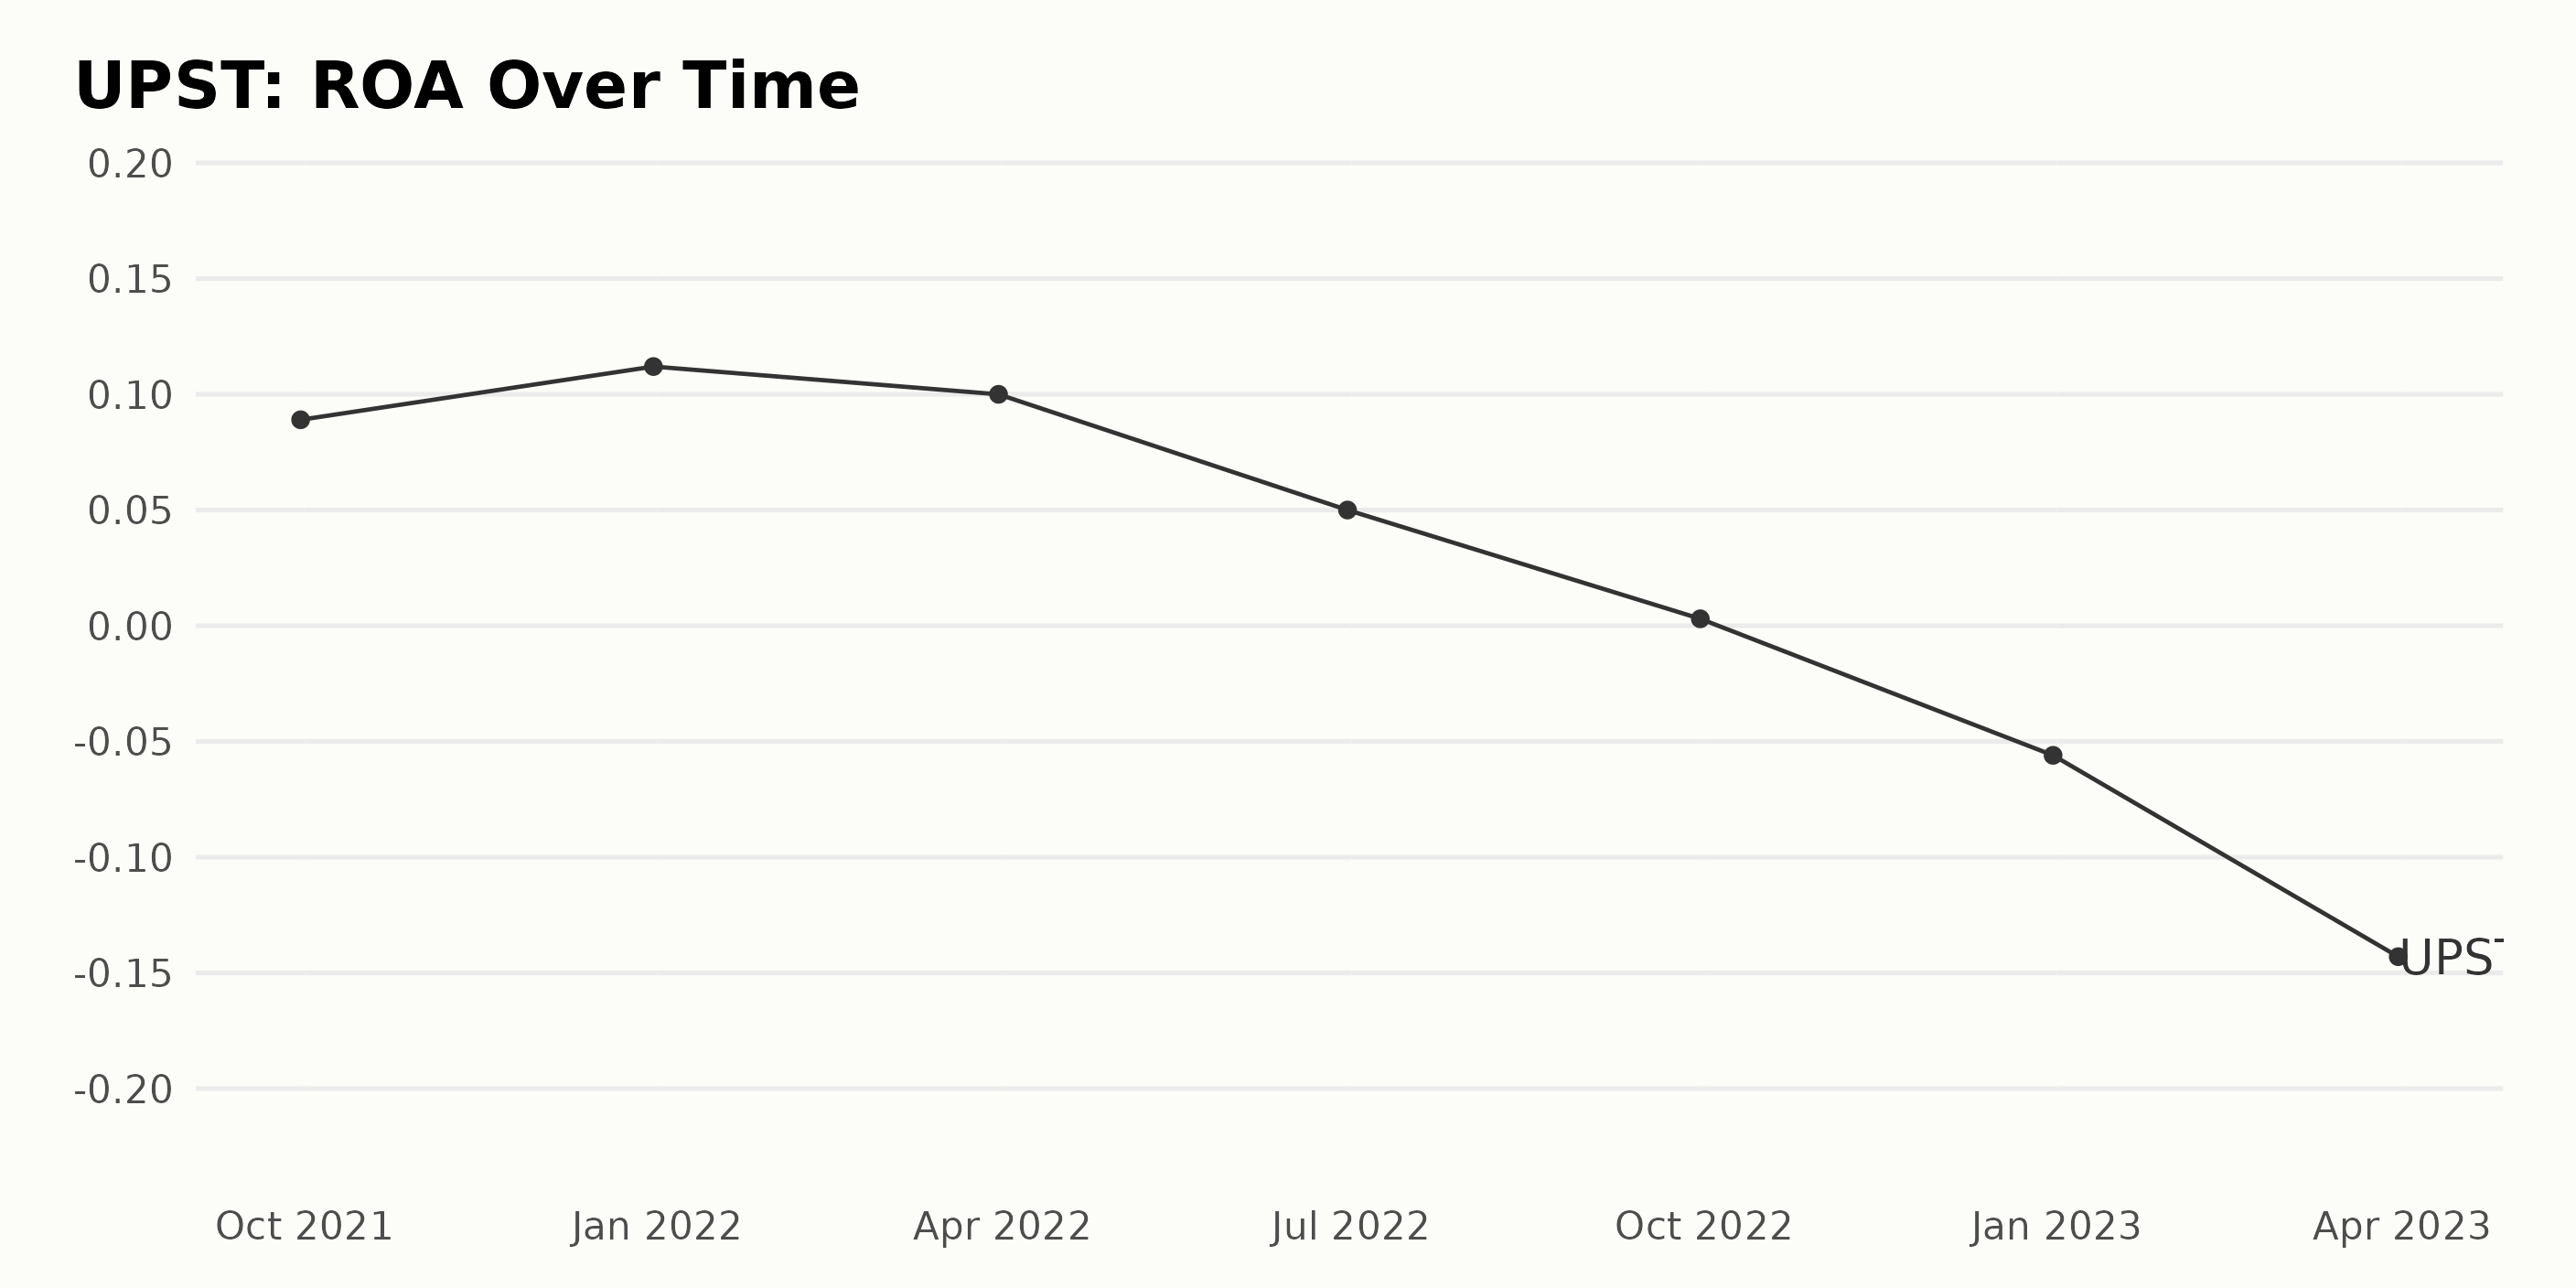
The Return on Assets (ROA) of UPST has followed a generally downward trend from the 2021 third quarter to the 2023 first quarter. Here is a detailed summary:
- As of September 2021, UPST recorded a ROA value of 8.9%.
- By December 2021, ROA had seen an increase, reaching a peak of 11.2%. This represented a quarterly growth rate of approximately 25.8% from September 2021.
- In the subsequent quarters of 2022, UPST’s ROA entered a decline: 10% in March, falling sharply to 5% in June and plummeting to 0.3% by September.
- The downward trajectory continued even further into the negative territory in the last quarter of 2022, with the ROA standing at -5.6 % in December.
- As of the most recent data point in March 2023, UPST’s ROA dropped to -14.3%, marking its lowest point within the observed timeframe.
In summary, over the observed period from September 2021 to March 2023, UPST’s ROA had decreased overall, with a growth rate of -161.8% computed from the first to the last value. This demonstrates a significant fluctuation and decline in company performance, as reported by this particular metric.
2023 Half-Year Review: UPST’s Rollercoaster Ride to Record Share Price
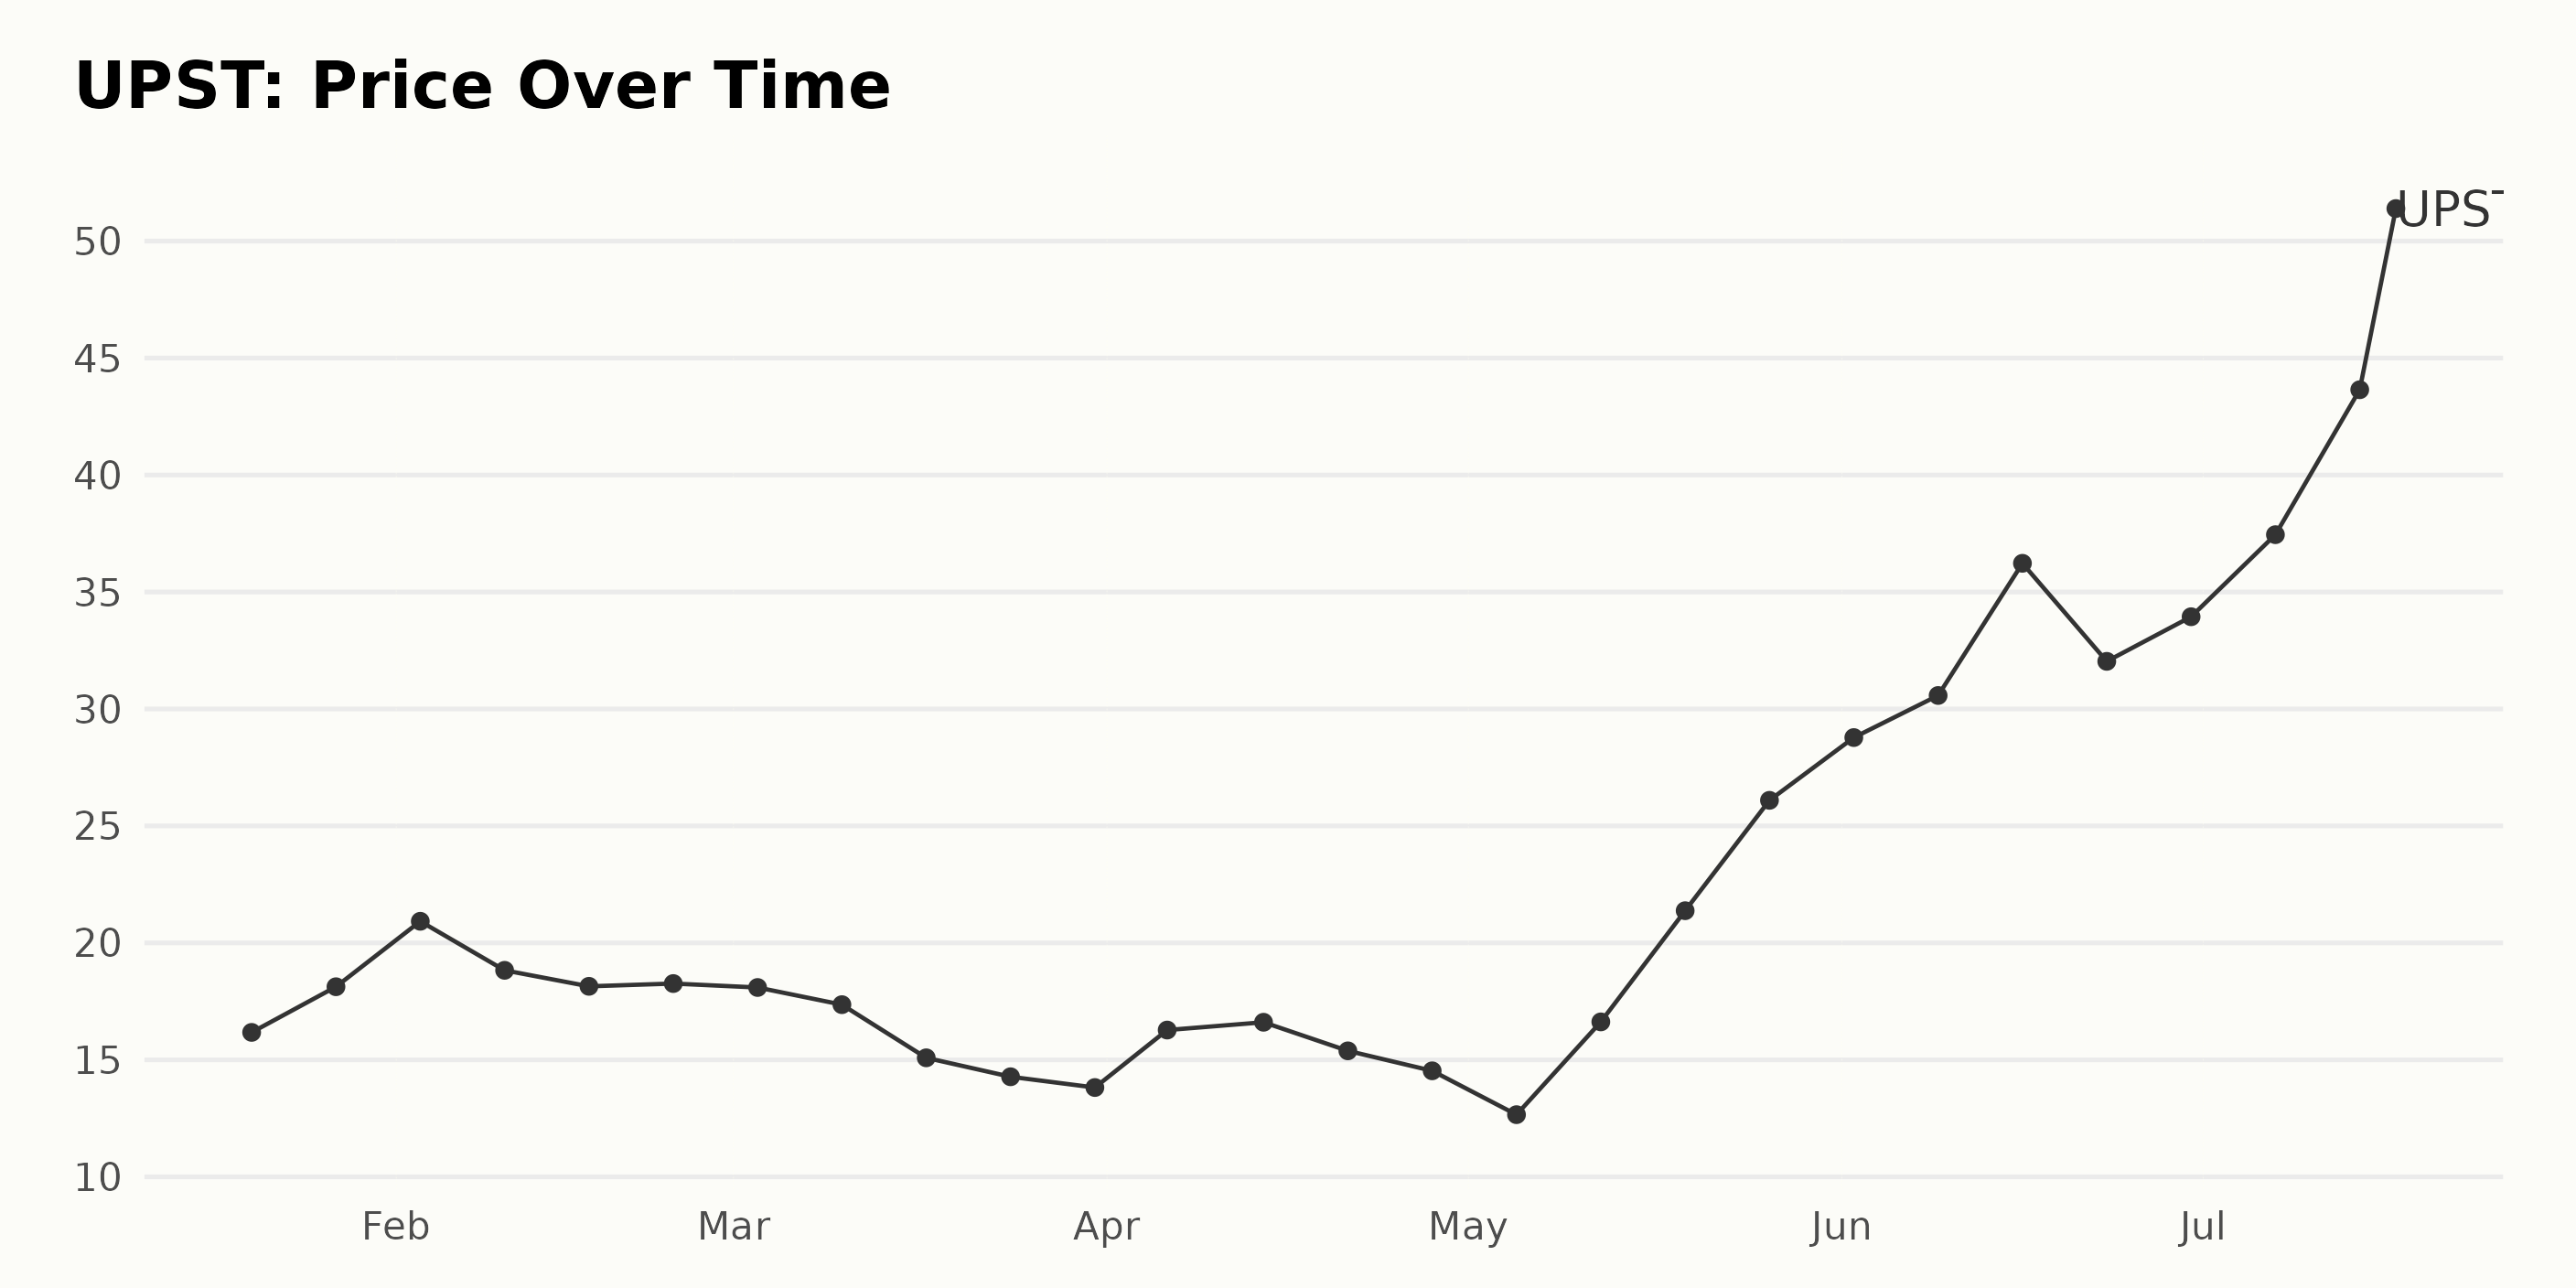
Analyzing the data provided shows an overall upward trend in the share price of UPST from January to July 2023. However, this growth was not linear, with periods of price fall followed by sharp increases:
- On January 20, 2023, the share price started at $16.18, increased slightly to $18.13 on January 27, then rose more sharply, reaching $20.92 by February 3.
- From February 3 until April 14, the price showed a general downward trend falling from a high of $20.92 to reach $16.61.
- The same pattern of decline continued till May 5, when UPST’s price hit a low point at $12.66 but recovered significantly by May 19 with a surge to $21.38.
- An acceleration period ensued from May 19, peaking on July 17, with the share price catapulting from $21.38 to $52.91.
To summarize, the first half of 2023 saw UPST’s share price starting at $16.18, reaching a low of $12.66, and then significantly increasing to close at its high of $52.91 by mid-July. Despite some periods of downward progression, the overall trend is strongly upward. Here is a chart of UPST’s price over the past 180 days.
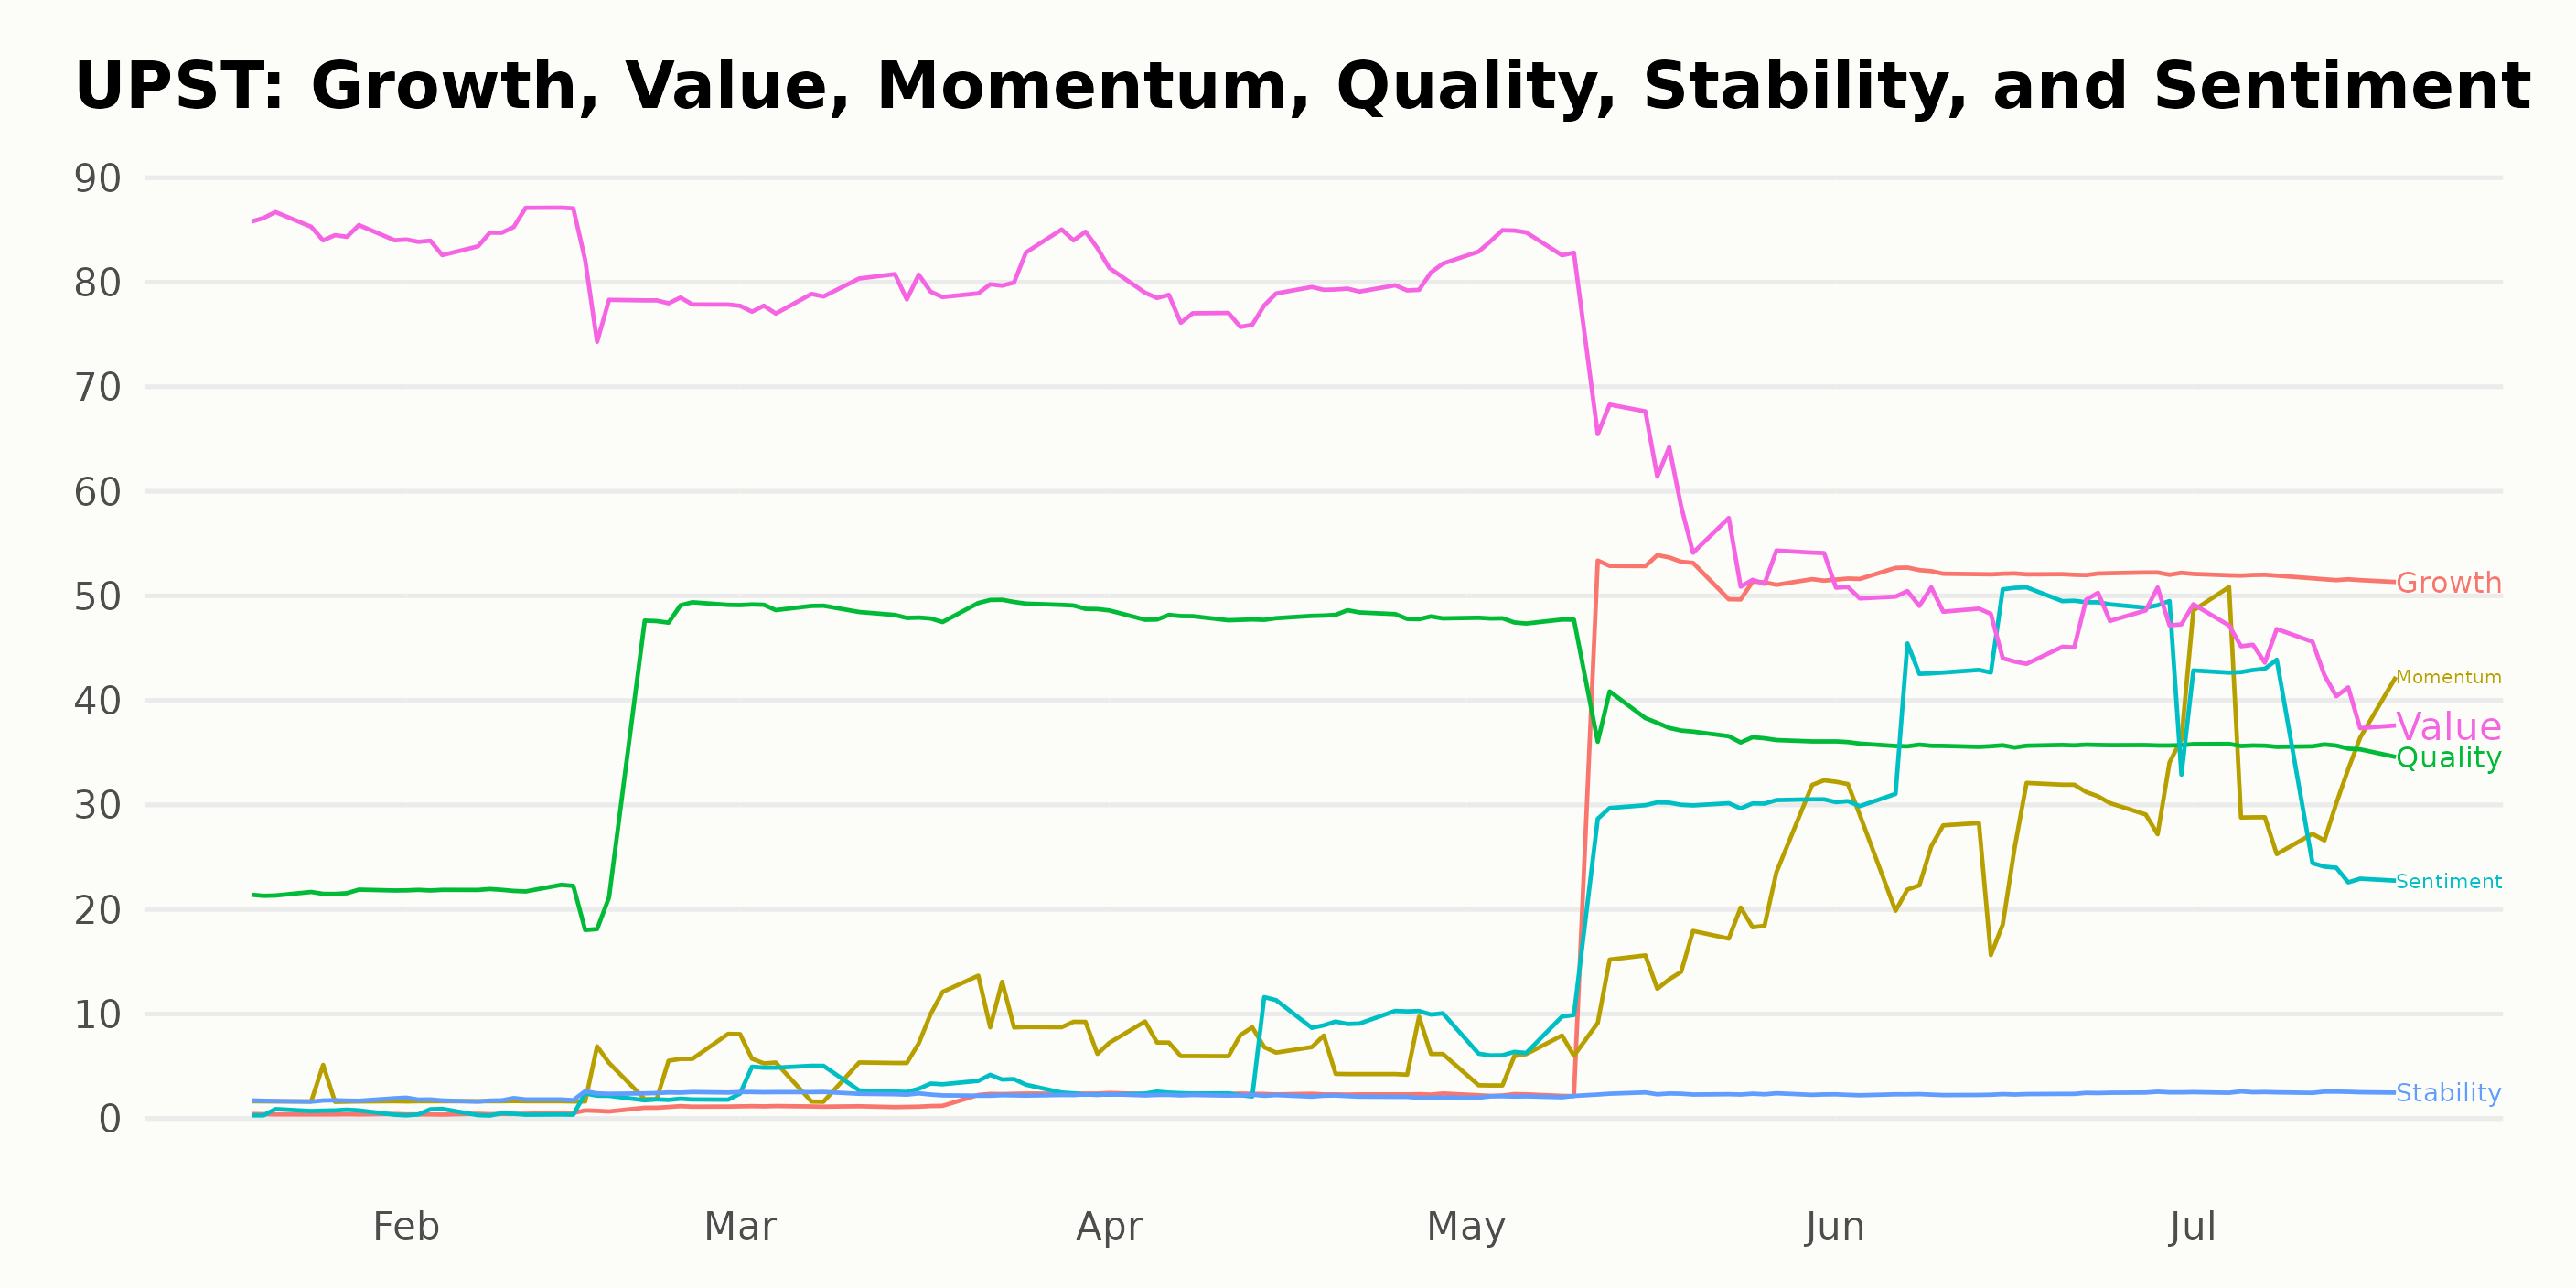
Assessing UPST’s POWR Ratings
UPST has an overall D rating, translating to a Sell in our POWR Ratings system. It is ranked #77 out of the 100 stocks in the Financial Services (Enterprise) category. It has an F grade in Stability and a D in Sentiment.
Here is an overview of the latest data points:
- The rank within its category was 97 on January 21, 2023.
- Its rank reached as high as 96 in the week of January 28, 2023.
- The lowest rank was 70 in the week of May 13, 2023.
- As of July 17, 2023, its category rank is 77.
It’s worth noting that for rank in the category, lower values signify a superior rank. The descending rank over the course of these dates indicates that UPST’s performance within its category is improved, despite the persisting D POWR grade. Remember to track these performance parameters regularly since market conditions change rapidly.
Stocks to Consider Instead of Upstart Holdings, Inc. (UPST)
Other stocks in the Financial Services (Enterprise) sector that may be worth considering are Everi Holdings Inc. (EVRI), Jiayin Group Inc. (JFIN), and Fiserv Inc. (FISV) -- they have better POWR Ratings.
What To Do Next?
Discover 10 widely held stocks that our proprietary model shows have tremendous downside potential. Please make sure none of these “death trap” stocks are lurking in your portfolio:
UPST shares were trading at $53.35 per share on Tuesday afternoon, up $0.44 (+0.83%). Year-to-date, UPST has gained 303.56%, versus a 19.35% rise in the benchmark S&P 500 index during the same period.
About the Author: Subhasree Kar

Subhasree’s keen interest in financial instruments led her to pursue a career as an investment analyst. After earning a Master’s degree in Economics, she gained knowledge of equity research and portfolio management at Finlatics.
The post Is Upstart Holdings (UPST) Actually a Good Buy? appeared first on StockNews.com