


Oil and gas industry behemoth Exxon Mobil Corporation (XOM) anticipates its motor fuels and chemicals earnings to reach $16 billion by 2027, up about $4 billion from current levels due to a continuous rise in demand.
The company has expanded its refining capacity and is focusing on higher-margin chemicals. XOM seems set for a breakout due to rising bullish sentiment for energy assets.
Contrarily, the company could run into some legal troubles. Alongside other big oil companies, XOM was sued by the state of California for supposedly playing down the risks posed by fossil fuels. This follows a string of lawsuits against fossil fuel giants for climate impacts.
Moreover, due to a greater focus on environmental concerns than ever before and as energy recovery runs out of steam, despite a rise in the current year, oil demand is expected to sharply slow to around 1 mb/d in 2024.
Given this backdrop, let’s look at the trends of XOM’s key financial metrics to understand why it could be wise to wait for a better entry point in the stock.
Exxon Mobil's Financials and Performance Overview: Analyzing Upswings and Challenges from 2020 to 2023
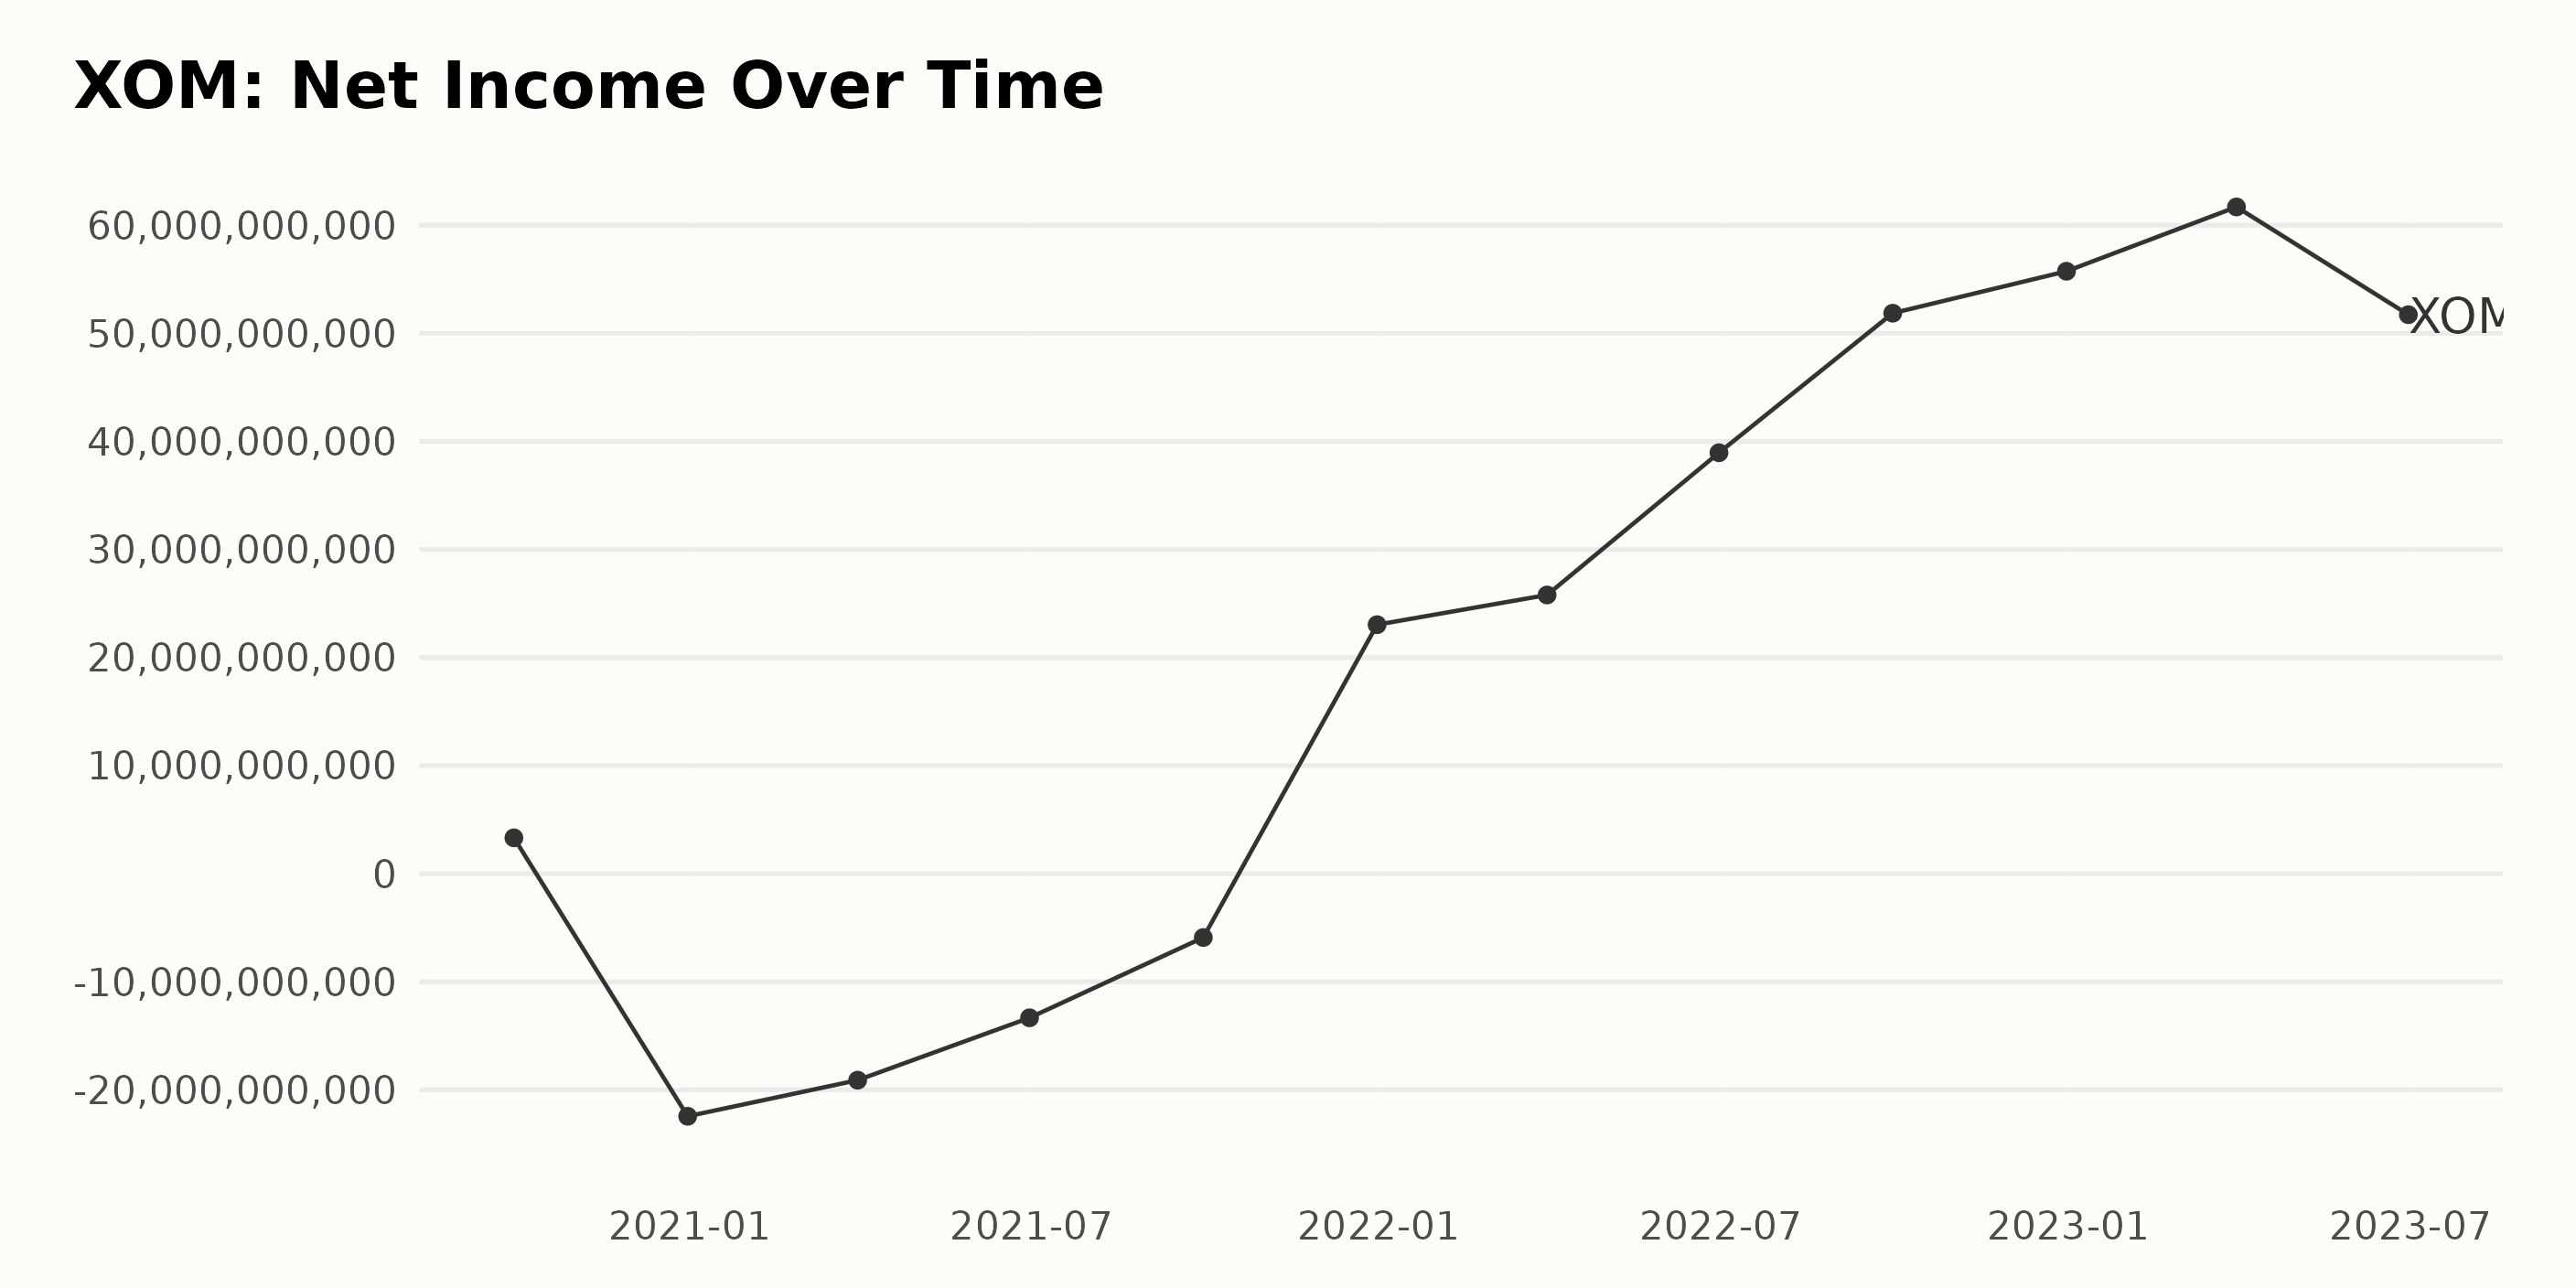
The trailing-12-month net income of XOM has displayed certain fluctuations from September 2020 to June 2023.
- In September 2020, the net income was approximately $3.32 billion; however, by the end of the year, on December 31, 2020, the company reported a loss of $-22.44 billion.
- The negative trend continued well into 2021, with substantial losses reported. By March 31, 2021, the reported net income was -$19.1 billion and posted a loss of -$13.33 billion by June 30, 2021.
- A slight recovery was seen by September 30, 2021, with the net income improving to a loss of -$5.9 billion. However, the turnaround for XOM came late in the year, as the company ended December 31, 2021, on a strong note, reporting a positive net income of $23.04 billion.
- Throughout 2022, XOM's net income has risen steadily. It started the year at $25.79 billion in March and increased nearly 51% to $38.95 billion in June. XOM then reported a record $51.86 billion and $55.74 billion in September and December, respectively.
- In the initial months of 2023, XOM's net income saw mixed results, reaching a high of $61.69 billion in March before slightly withdrawing to $51.72 billion by the end of June 2023.
Overall, the growth rate between September 2020 and June 2023 computes to extraordinary progress from $3.32 billion to $51.72 billion, showing strong trends in the profits of XOM despite notable dips in 2020 and half of 2021.
The data clearly indicates that while there were significant financial challenges in 2020 and 2021, the company has since rebounded and demonstrated substantial profit growth, especially over 2022 and the first half of 2023. The emphasis on recent data indicates that the current trend for XOM's net income shows a major recovery and strong growth.
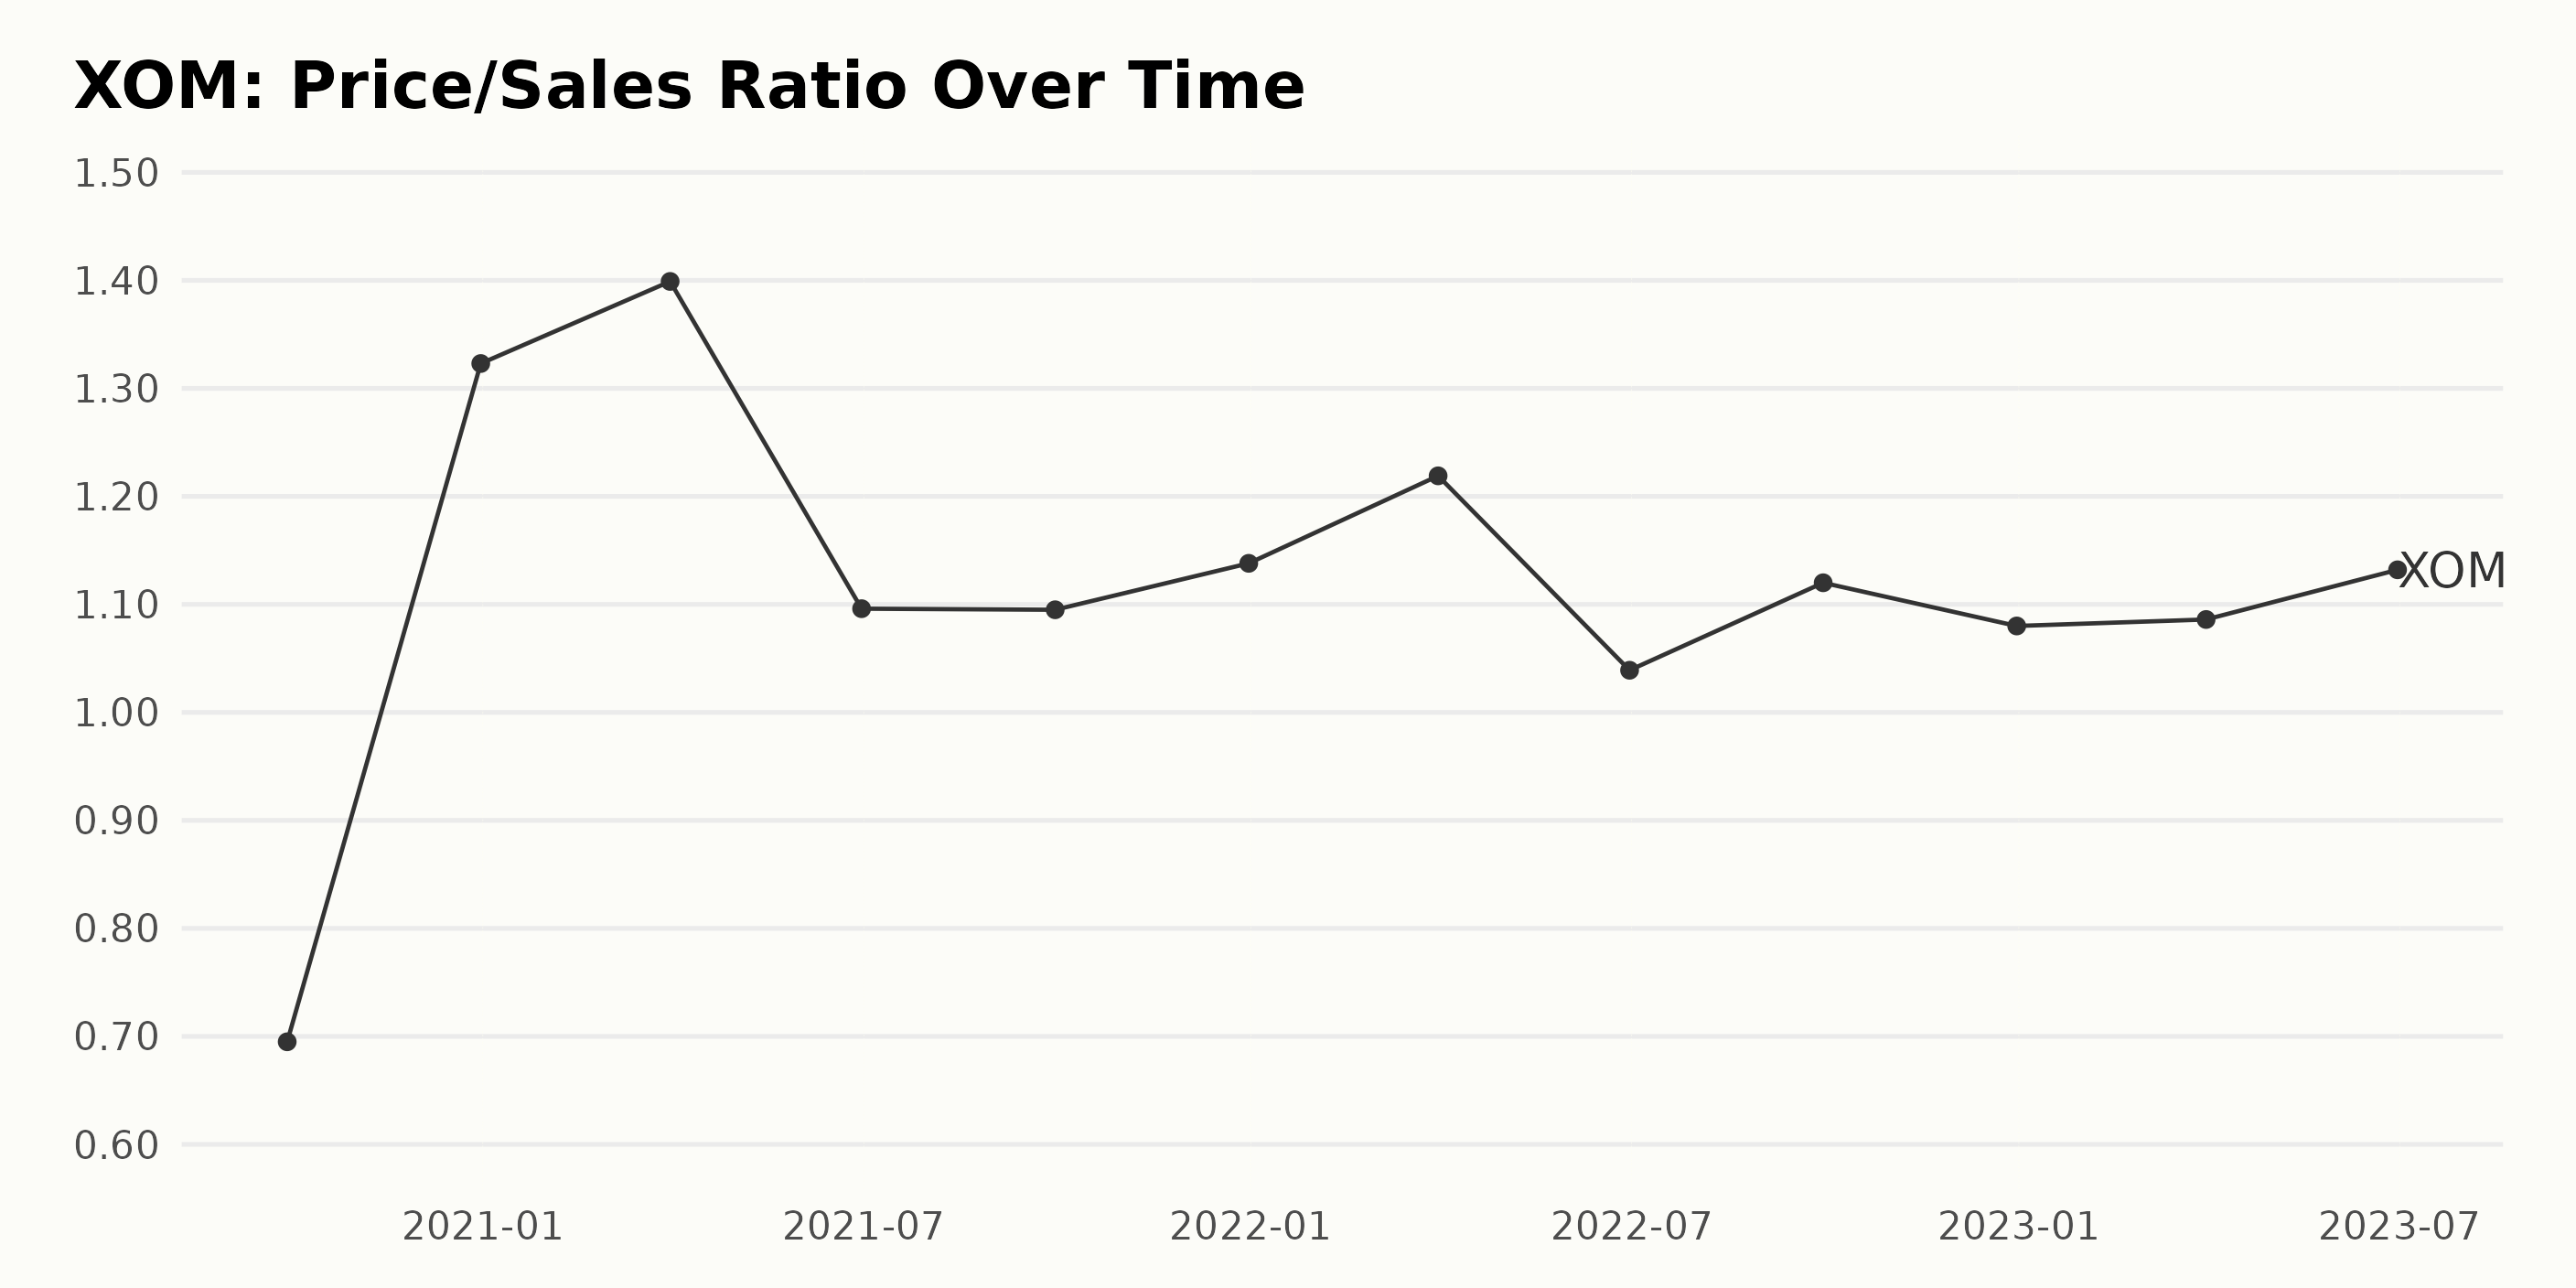
The historical trend of XOM’s Price/Sales ratio (P/S) is as follows:
- Beginning at a P/S of 0.70 on September 30, 2020, there was a remarkable increase in the P/S ratio in the following quarter ending December 31, 2020, reaching a value of 1.32.
- The P/S ratio continued to show an upward movement in the first quarter of 2021, rising slightly to 1.40 by the end of March. However, there was a notable downturn toward mid-year, with the P/S dropping to 1.10 by June 30, 2021.
- Over the course of the following year (from September 30, 2021, to June 30, 2022), the ratio experienced minor fluctuations around the 1.10 to 1.22 range, suggesting a steadier trend during this period.
- Toward the final quarters of 2022 and into 2023, there seem to be no rapid changes, with variations above and below the 1.10 mark, demonstrating a stable condition in XOM's P/S value.
- Notably, the ratio rose by approximately 62% over the reported period, from 0.70 on September 30, 2020, to 1.13 by the end of June 2023. Emphasizing more recent information, the latest data point indicates that XOM's P/S ratio stands at 1.13 as of June 30, 2023.
- This is slightly higher than the 1.08 recorded at the previous year's close. In the three months leading up to this point, the ratio experienced a slight uptick from 1.09 in March 2023.
In summary, over the approximately three-year period covered by this data, XOM's P/S ratio has shown a general upward trend with some fluctuations. Despite periods of decline and stabilization, the overall growth of approximately 62% indicates an improved evaluation of the company's sales relative to its share price.
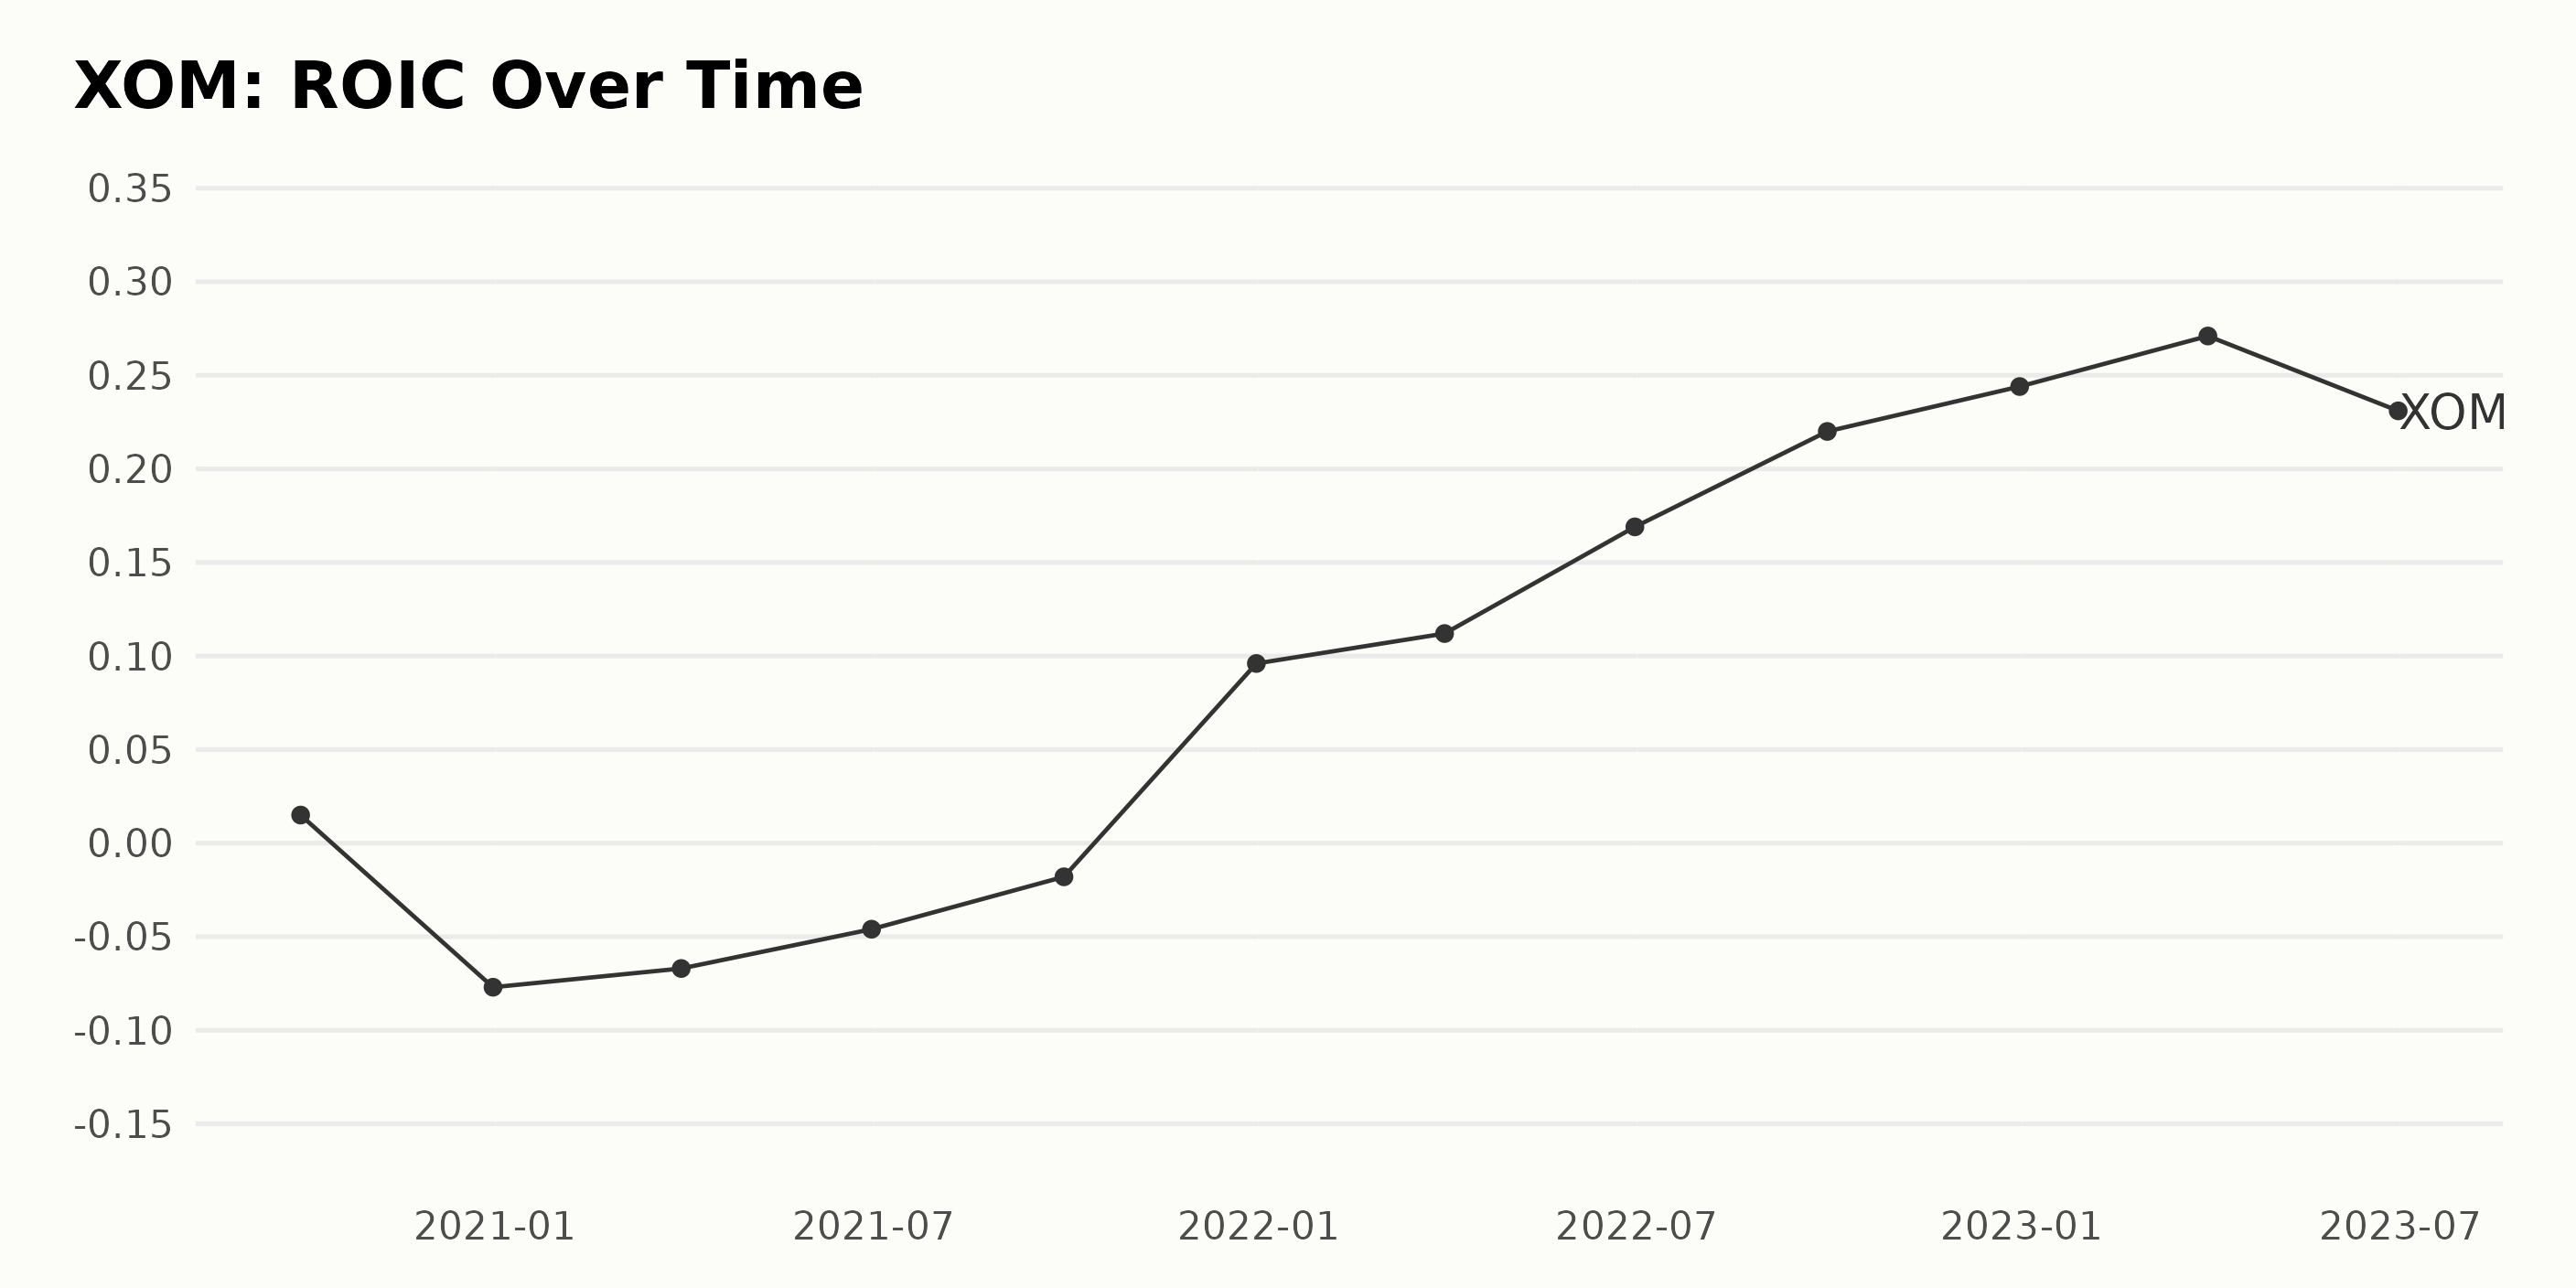
The Return On Invested Capital (ROIC) for XOM shows a noticeable upward trend over the given series of data despite fluctuations during the observed period.
- As of September 2020, the ROIC was recorded at 0.015 or 1.5%.
- A significant plunge was observed by December 2020, with the ROIC dropping to -0.077 or -7.7%, which continued till June 2021, when it reached -0.046 or -4.6%.
- Starting from September 2021 (-0.018 or -1.8%), there was a consistent increase in ROIC, reaching as high as 0.271 or 27.1% by March 2023.
- The latest recorded value, as of June 2023, indicates a dip to 0.231 or 23.1%.
From the first value in September 2020 to the last value in June 2023, the growth rate in ROIC is around 1,542%. Therefore, despite occasional drops, overall, XOM has seen substantial improvement in ROIC, particularly since the rise beginning in September 2021.
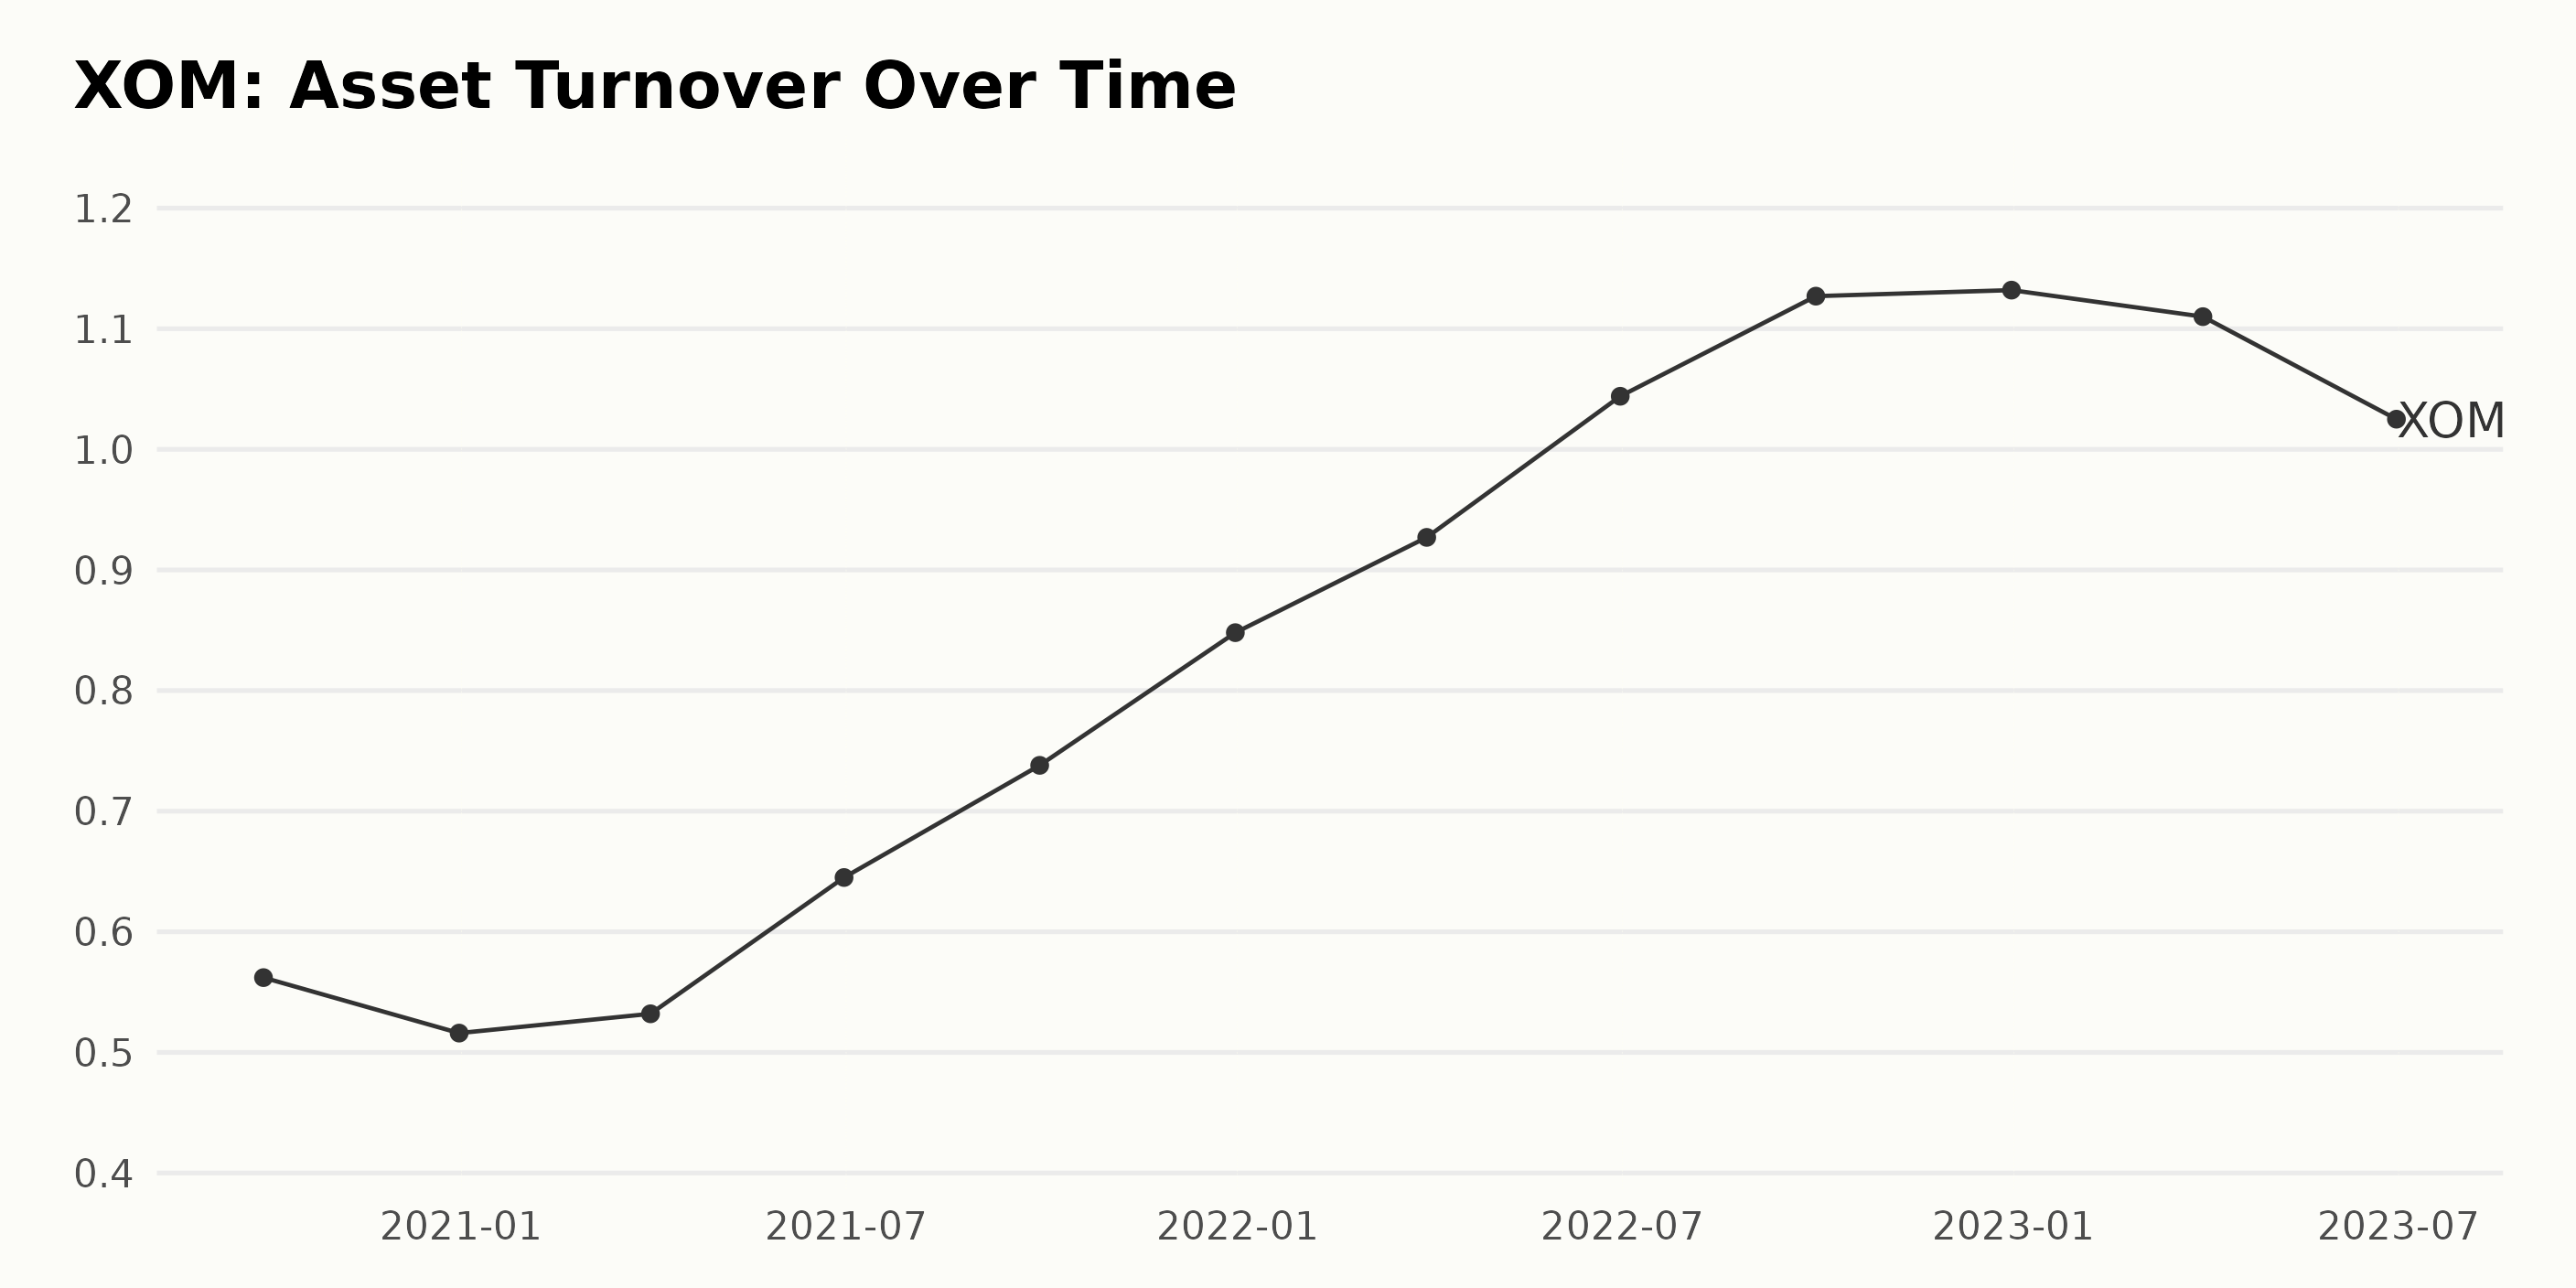
XOM’s asset turnover has been witnessing noticeable changes over the last few years:
- On September 30, 2020, the asset turnover was 0.562.
- Slight ups and downs were observed during the subsequent periods: 0.516 on December 31, 2020, and 0.532 on March 31, 2021.
- By June 30, 2021, the figure had surged to 0.645 and continued its upward trend, registering 0.738 by September 30, 2021.
- The asset turnover skyrocketed during the last quarter of 2021 into 2022, with 0.848 on December 31, 2021, and further increasing to 0.927 on March 31, 2022.
- The asset turnover crossed the 1 mark by June 30, 2022, reaching 1.044, and it continued increasing until September 30, 2022, when it hit 1.127.
- Toward the end of 2022, the asset turnover continued to grow marginally to 1.132 on December 31, 2022.
- However, a downward trend is noted in 2023, with the asset turnover dropping to 1.11 on March 31, 2023, and further dipping to 1.025 by June 30, 2023.
Over this period, XOM asset turnover recorded an overall increase, growing from 0.562 on September 30, 2020, to 1.025 by June 30, 2023. This translates to a growth rate of approximately 82.38%. Emphasis on the most recent data shows a fluctuating trend with a slight dip in figures for 2023 after significant growth in the previous years.
Exxon Mobil Stock: An Overview of Fluctuating Trends and Overall Growth
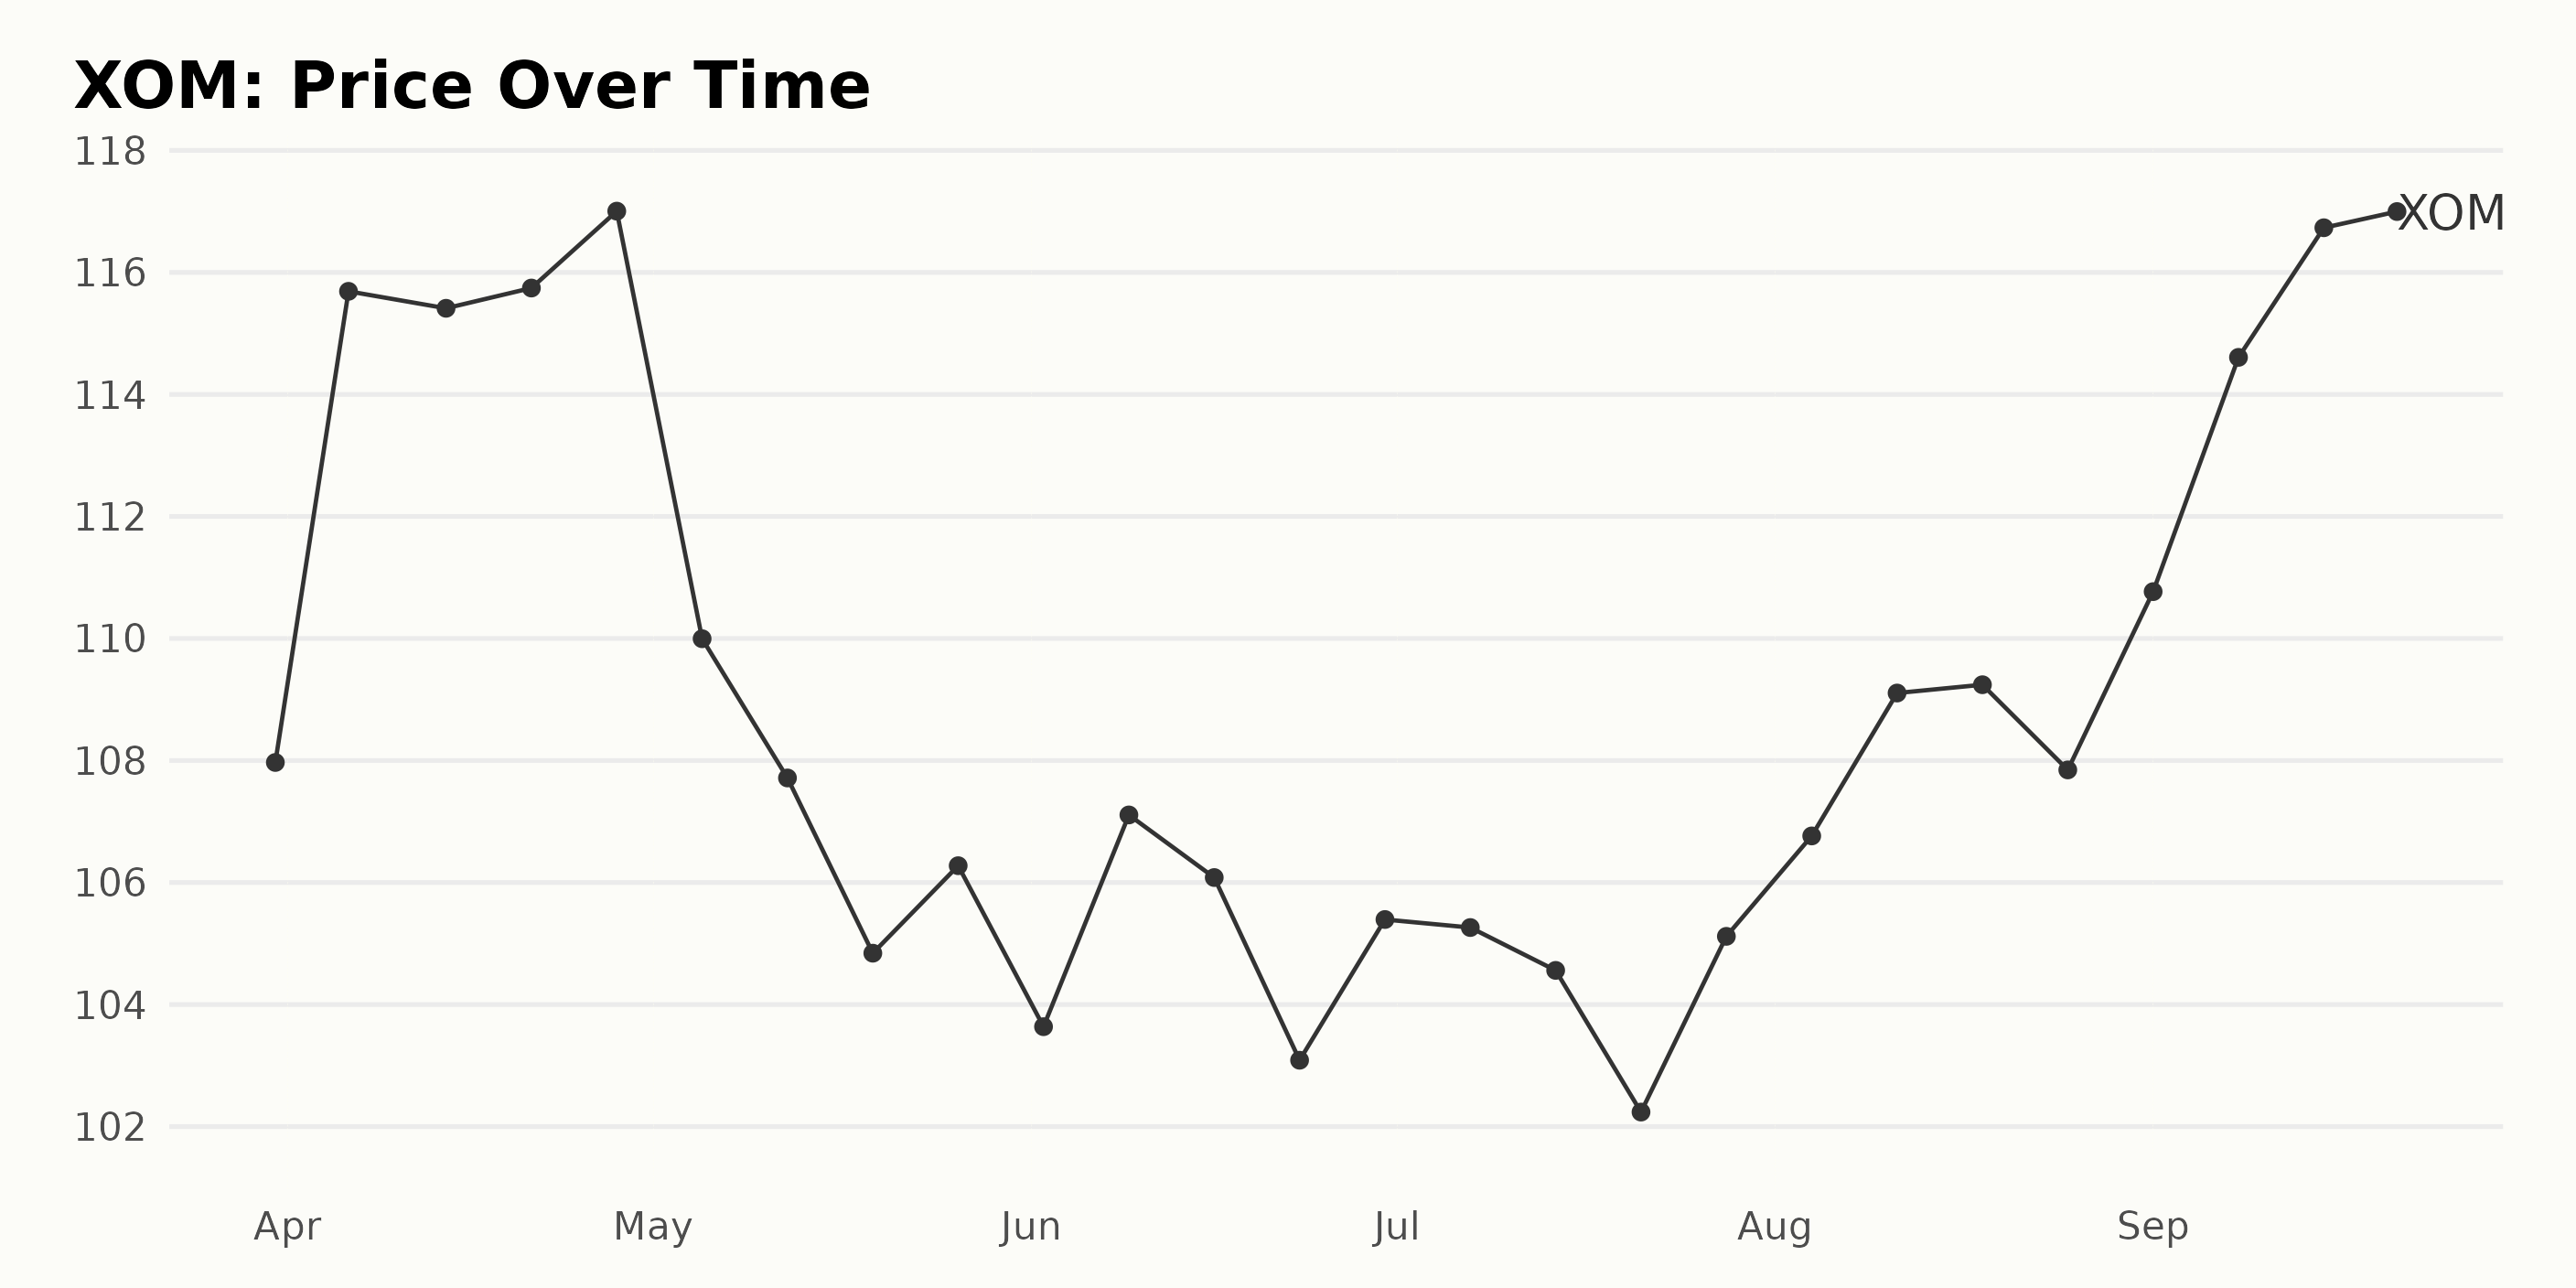
The share price trend of XOM over the specified period could be described as fluctuating with an overall upward bias. The growth rate experienced slight deceleration and acceleration at different times during this period but ultimately displayed an uptick. Reviewing the data in detail:
- At the start of the given timeline in March 2023, XOM's share price was at $107.97.
- By April 2023, there was a noticeable growth in the share price, reaching a peak value of $117.00 by the end of the month.
- The growth halted and reversed in May 2023, with the price declining each week from $109.99 in early May to $104.84 by mid-May and then slightly increasing to $106.28 by the end of the month.
- Through June and July 2023, the trends were quite unstable, with a pattern of fluctuation in price. The share price hovered around $105, with the lowest at $102.24 and the highest at $107.11.
- Beginning August 2023, the share price started a somewhat consistent ascent, starting from $105.12 and gradually climbing to $116.73 midway through September 2023.
- By the end of the specified period on September 21, 2023, XOM's share price reached $114.76.
In conclusion, despite the fluctuations throughout this period, XOM shares exhibited an overall increase from $107.97 in March 2023 to $114.76 in September 2023. This suggests a generally positive growth rate over these six months.
The growth experienced some deceleration in May with a slight dip but resumed acceleration towards the end of the period. Here is a chart of XOM's price over the past 180 days.
Exxon Mobil Corporation: Strong Momentum, Quality, and Rising Stability, POWR Ratings Reveal
The POWR Ratings grade for XOM, which is in the Energy - Oil & Gas category of stocks, has been consistently at C (Neutral) from April 1, 2023, to September 22, 2023. Observations on the rank within its category during this period include:
- On April 1, 2023, it was ranked #42 out of a total of 88 stocks in this sector. This trend gradually increased into mid-May, with a rank of #49 on May 6, 2023.
- There was an improvement in its rank in late May and through June 2023 when it managed to maintain a stable rank of #33 till June 10, 2023, and then slightly dropping to #35 till June 24, 2023.
- In July 2023, the ranking took a slight dip, with a rank of #38 on July 15, 2023, but managed to come back to #34 by July 29, 2023.
- In August, the rank again started dropping, reaching #48 on August 9, 2023, improving to #43 by August 19, 2023, and then declining marginally to #44 by the end of the month.
- As of the latest data point on September 22, 2023, XOM's rank within its category stood at #39.
XOM has witnessed some fluctuations in its performance with respect to other stocks in the Energy - Oil & Gas category over this period. Its best rank was #33 (achieved multiple times), whereas the worst rank observed was #49. As of the latest provided date, XOM's position fell closer to the middle of the category ranking.
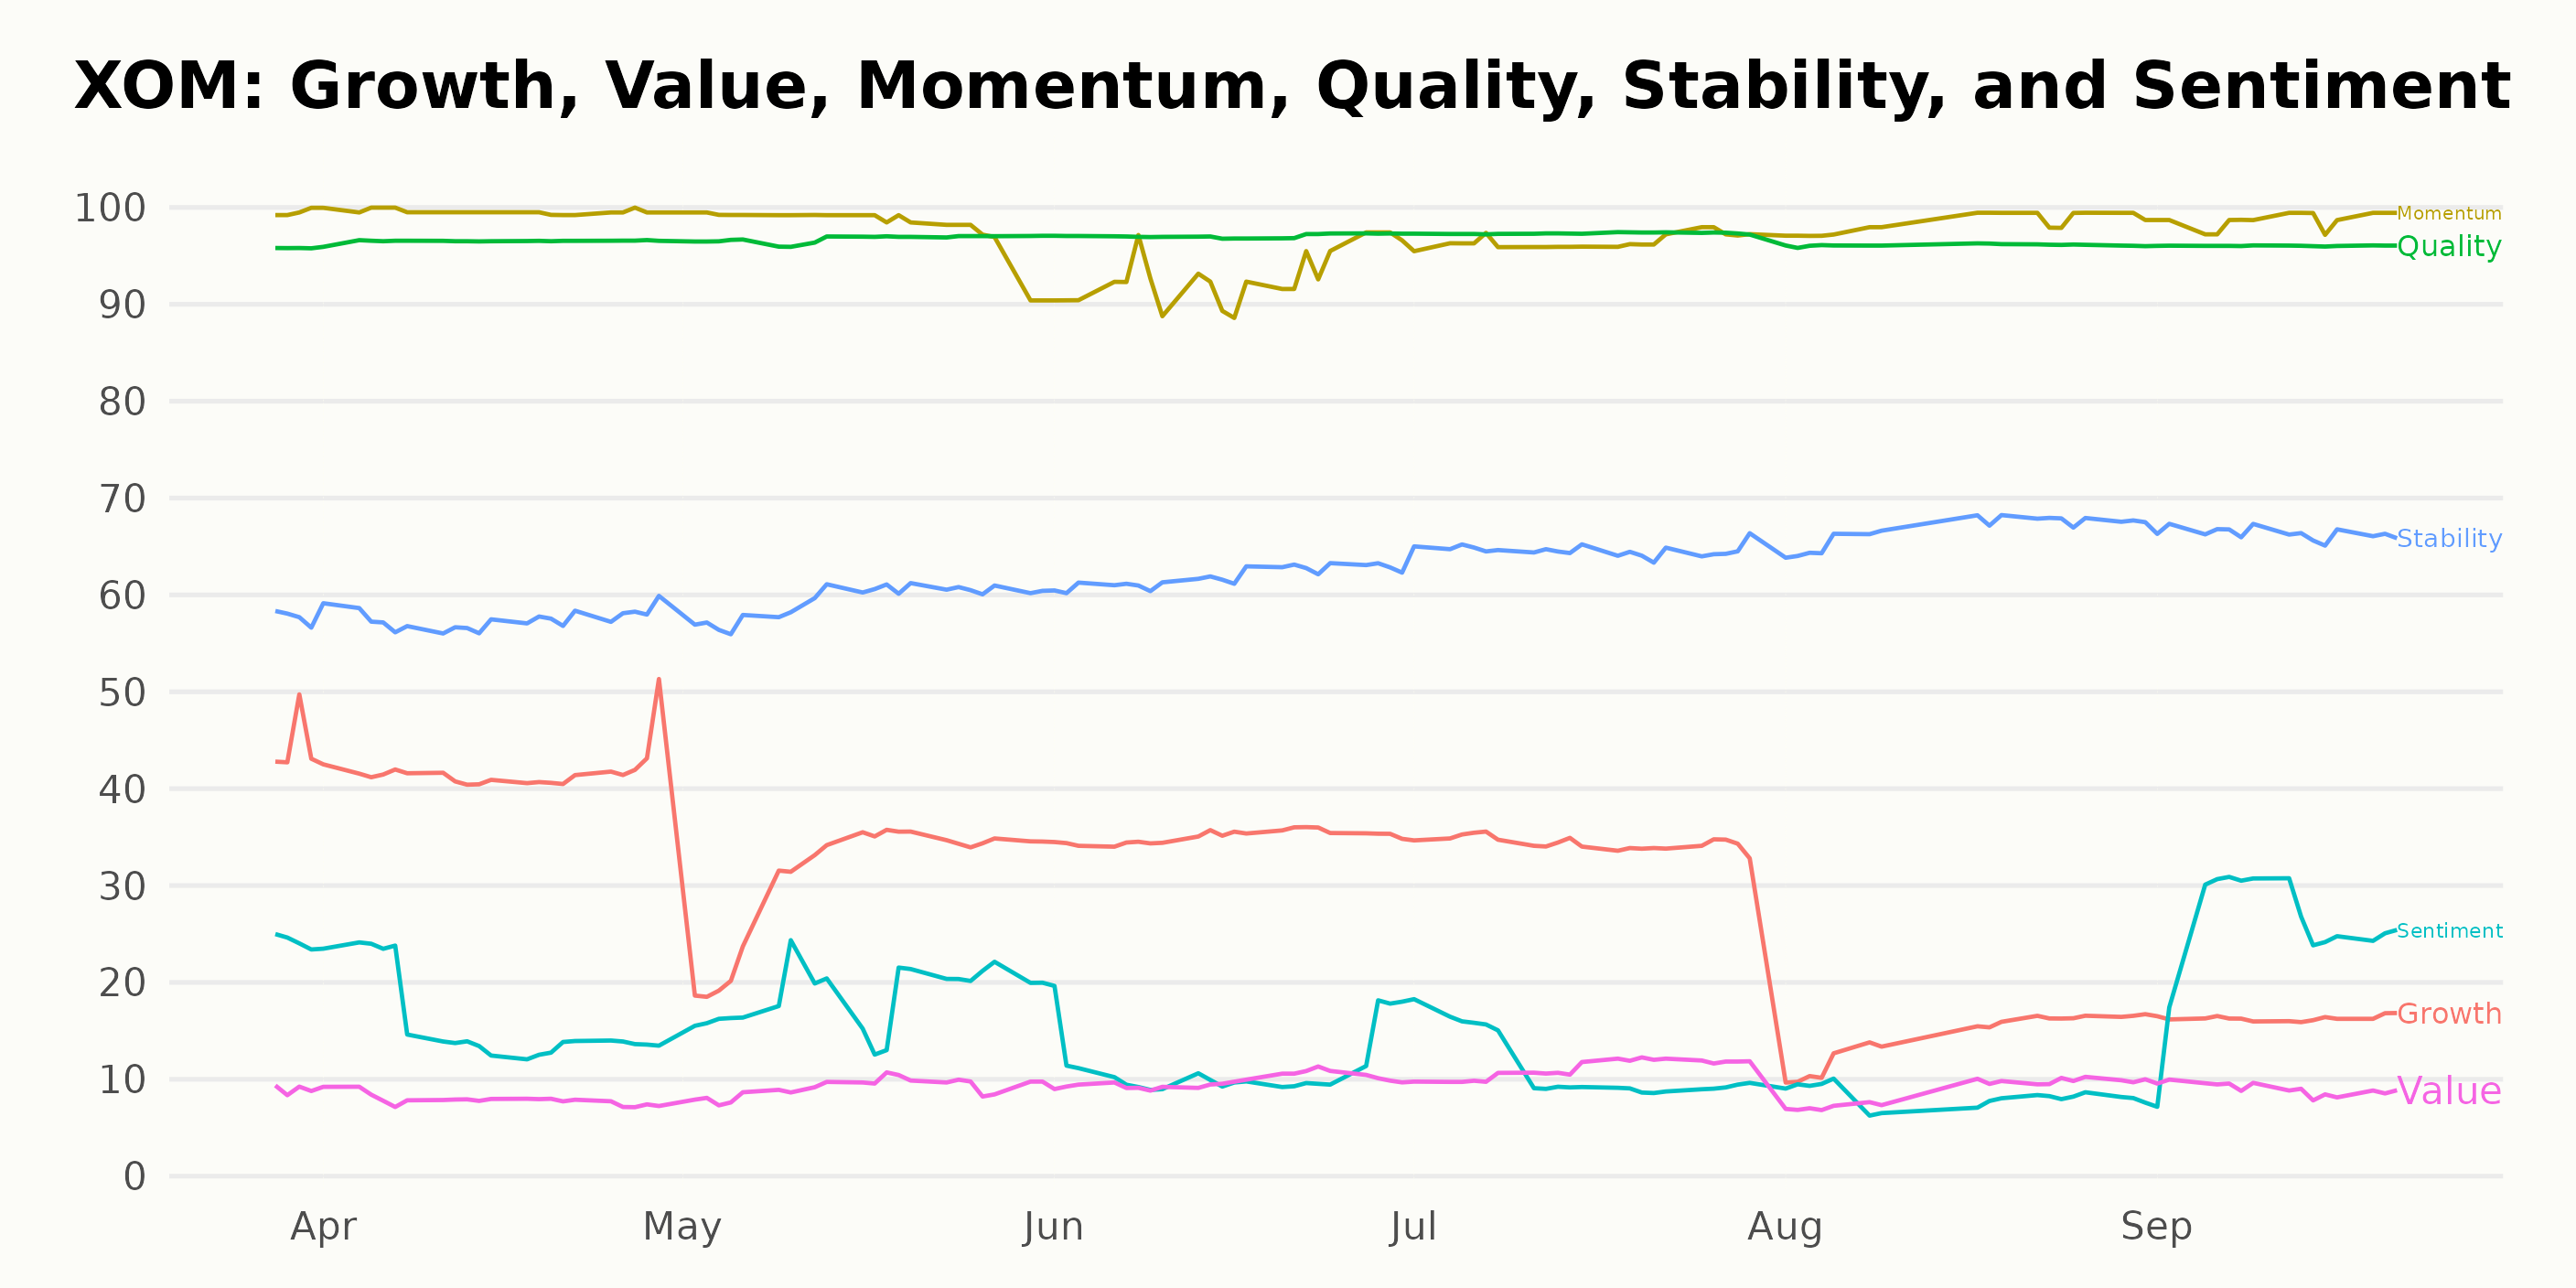
The POWR Ratings for XOM indicate noteworthy dimensions. The most significant are Momentum, Quality, and Stability.
- Momentum: This dimension consistently retains the highest rating amongst the three during the observed period. In March 2023, the Momentum rating stood at 99. By April 2023, it reached a peak of 100. The rating remained high, varying between 93 and 100, until September 2023, when it was again recorded at 99.
- Quality: Rating for Quality also remains very high throughout the observing window. Starting with a commendable rating of 96 in March 2023, it elevates to 97 the very next month and maintains this score for consecutive months until September 2023, when it dips slightly back to 96.
- Stability: The Stability dimension showcases an apparent upward trend during the analyzed period. Starting with a moderate rating of 58 in March 2023, it continues to show incremental improvement almost every month, reaching 67 by August 2023, and ending at 66 in September 2023.
These dimensions exhibit the strongest performance in terms of POWR Ratings for XOM. The ratings indicate a strong positive Momentum and Quality coupled with improving Stability.
How does Exxon Mobil Corporation (XOM) Stack Up Against its Peers?
Other stocks in the Energy - Oil & Gas sector that may be worth considering are Cheniere Energy, Inc. (LNG), Valero Energy Corporation (VLO), and CVR Energy, Inc. (CVI) - they have better POWR Ratings. Click here to explore more stocks in the Energy - Oil & Gas sector.
What To Do Next?
Discover 10 widely held stocks that our proprietary model shows have tremendous downside potential. Please make sure none of these “death trap” stocks are lurking in your portfolio:
XOM shares were trading at $115.54 per share on Friday afternoon, up $0.78 (+0.68%). Year-to-date, XOM has gained 7.35%, versus a 14.66% rise in the benchmark S&P 500 index during the same period.
About the Author: Anushka Dutta

Anushka is an analyst whose interest in understanding the impact of broader economic changes on financial markets motivated her to pursue a career in investment research.
The post Exxon Mobil (XOM) – Is It Time to Buy or Wait on This Energy Stock? appeared first on StockNews.com