


Warren Buffett’s investment conglomerate Berkshire Hathaway Inc. (BRK.B) reported its third-quarter earnings recently, reporting a 356.3% year-over-year rise in the net losses attributable to Berkshire shareholders to $12.77 billion. The company also signaled caution about the market environment and stock valuations.
On the other hand, BRK.B’s operating earnings climbed 40.6% from the prior-year quarter to $10.76 billion, and rising interest rates helped the company by boosting the yields of its significant U.S. Treasury bill holdings. Moreover, an uneventful hurricane season fortified its Geico car insurer and reinsurance businesses.
Given such mixed results, let’s look at BRK.B’s key financial metrics to get an idea of why it could be wise to watch and wait for a better entry point in the stock.
Exploring Berkshire Hathaway's Financial Performance: A Detailed Analysis of Key Metrics from 2020 to 2023
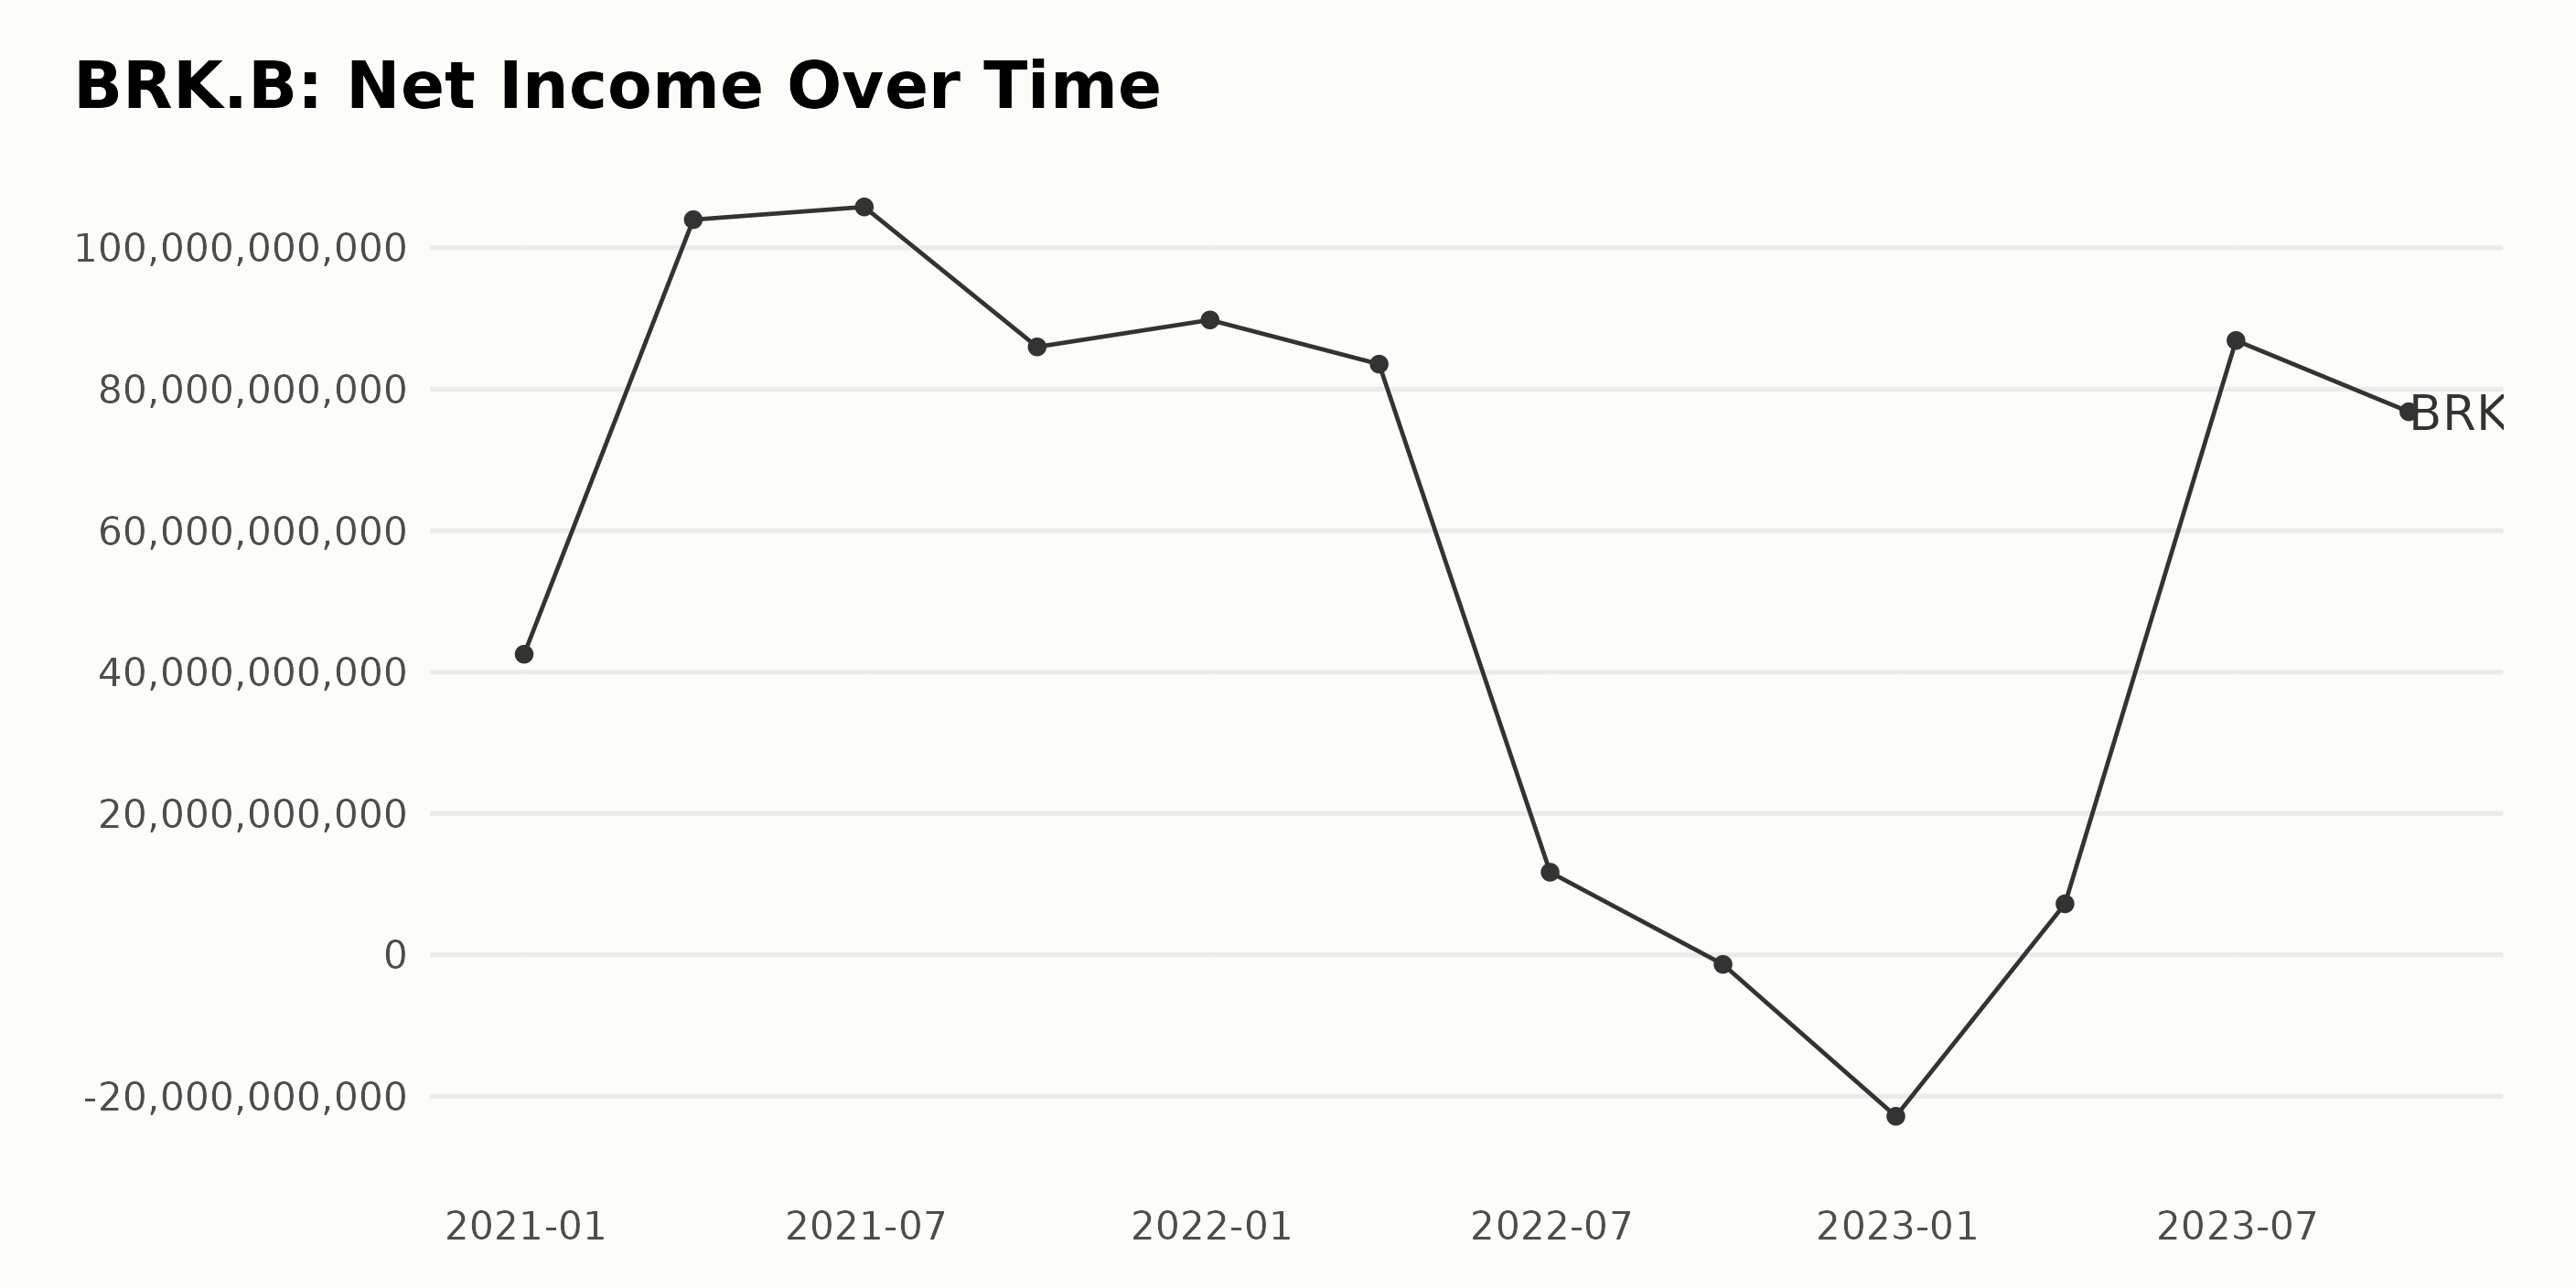
The reported trailing-12-month net income of BRK.B demonstrated significant fluctuation over the period. Key highlights include:
- The net income on December 31, 2020, started at a considerable $42.52 billion.
- There was a robust upsurge by March 31, 2021, reaching a notable peak of $103.98 billion, indicating a remarkable growth rate.
- This upward trend continued little until June 30, 2021, when net income slightly improved to $105.78 billion before commencing a declining sequence henceforth.
- Downward corrections were recorded in consecutive periods, with a noticeable drop in March 2022 to $83.54 billion and a significant plunge in June 2022 to $11.70 billion.
- A major downward spike was registered between September 2022 and December 2022, from a negative $1.34 billion to a near low of a negative $22.82 billion, indicating a period of financial loss.
- However, a recovery phase ensued from March 2023, starting at a humble $7.23 billion and subsequently reaching an encouraging peak of $86.89 billion in June 2023.
The most recent net income for BRK.B recorded in September 2023 was $76.81 billion, suggesting a relative improvement from the initial value at the inception of the data set but a decrease from the June 2023 peak.
The overall trend shows volatility in BRK.B's net income with alternating periods of growth and decline.
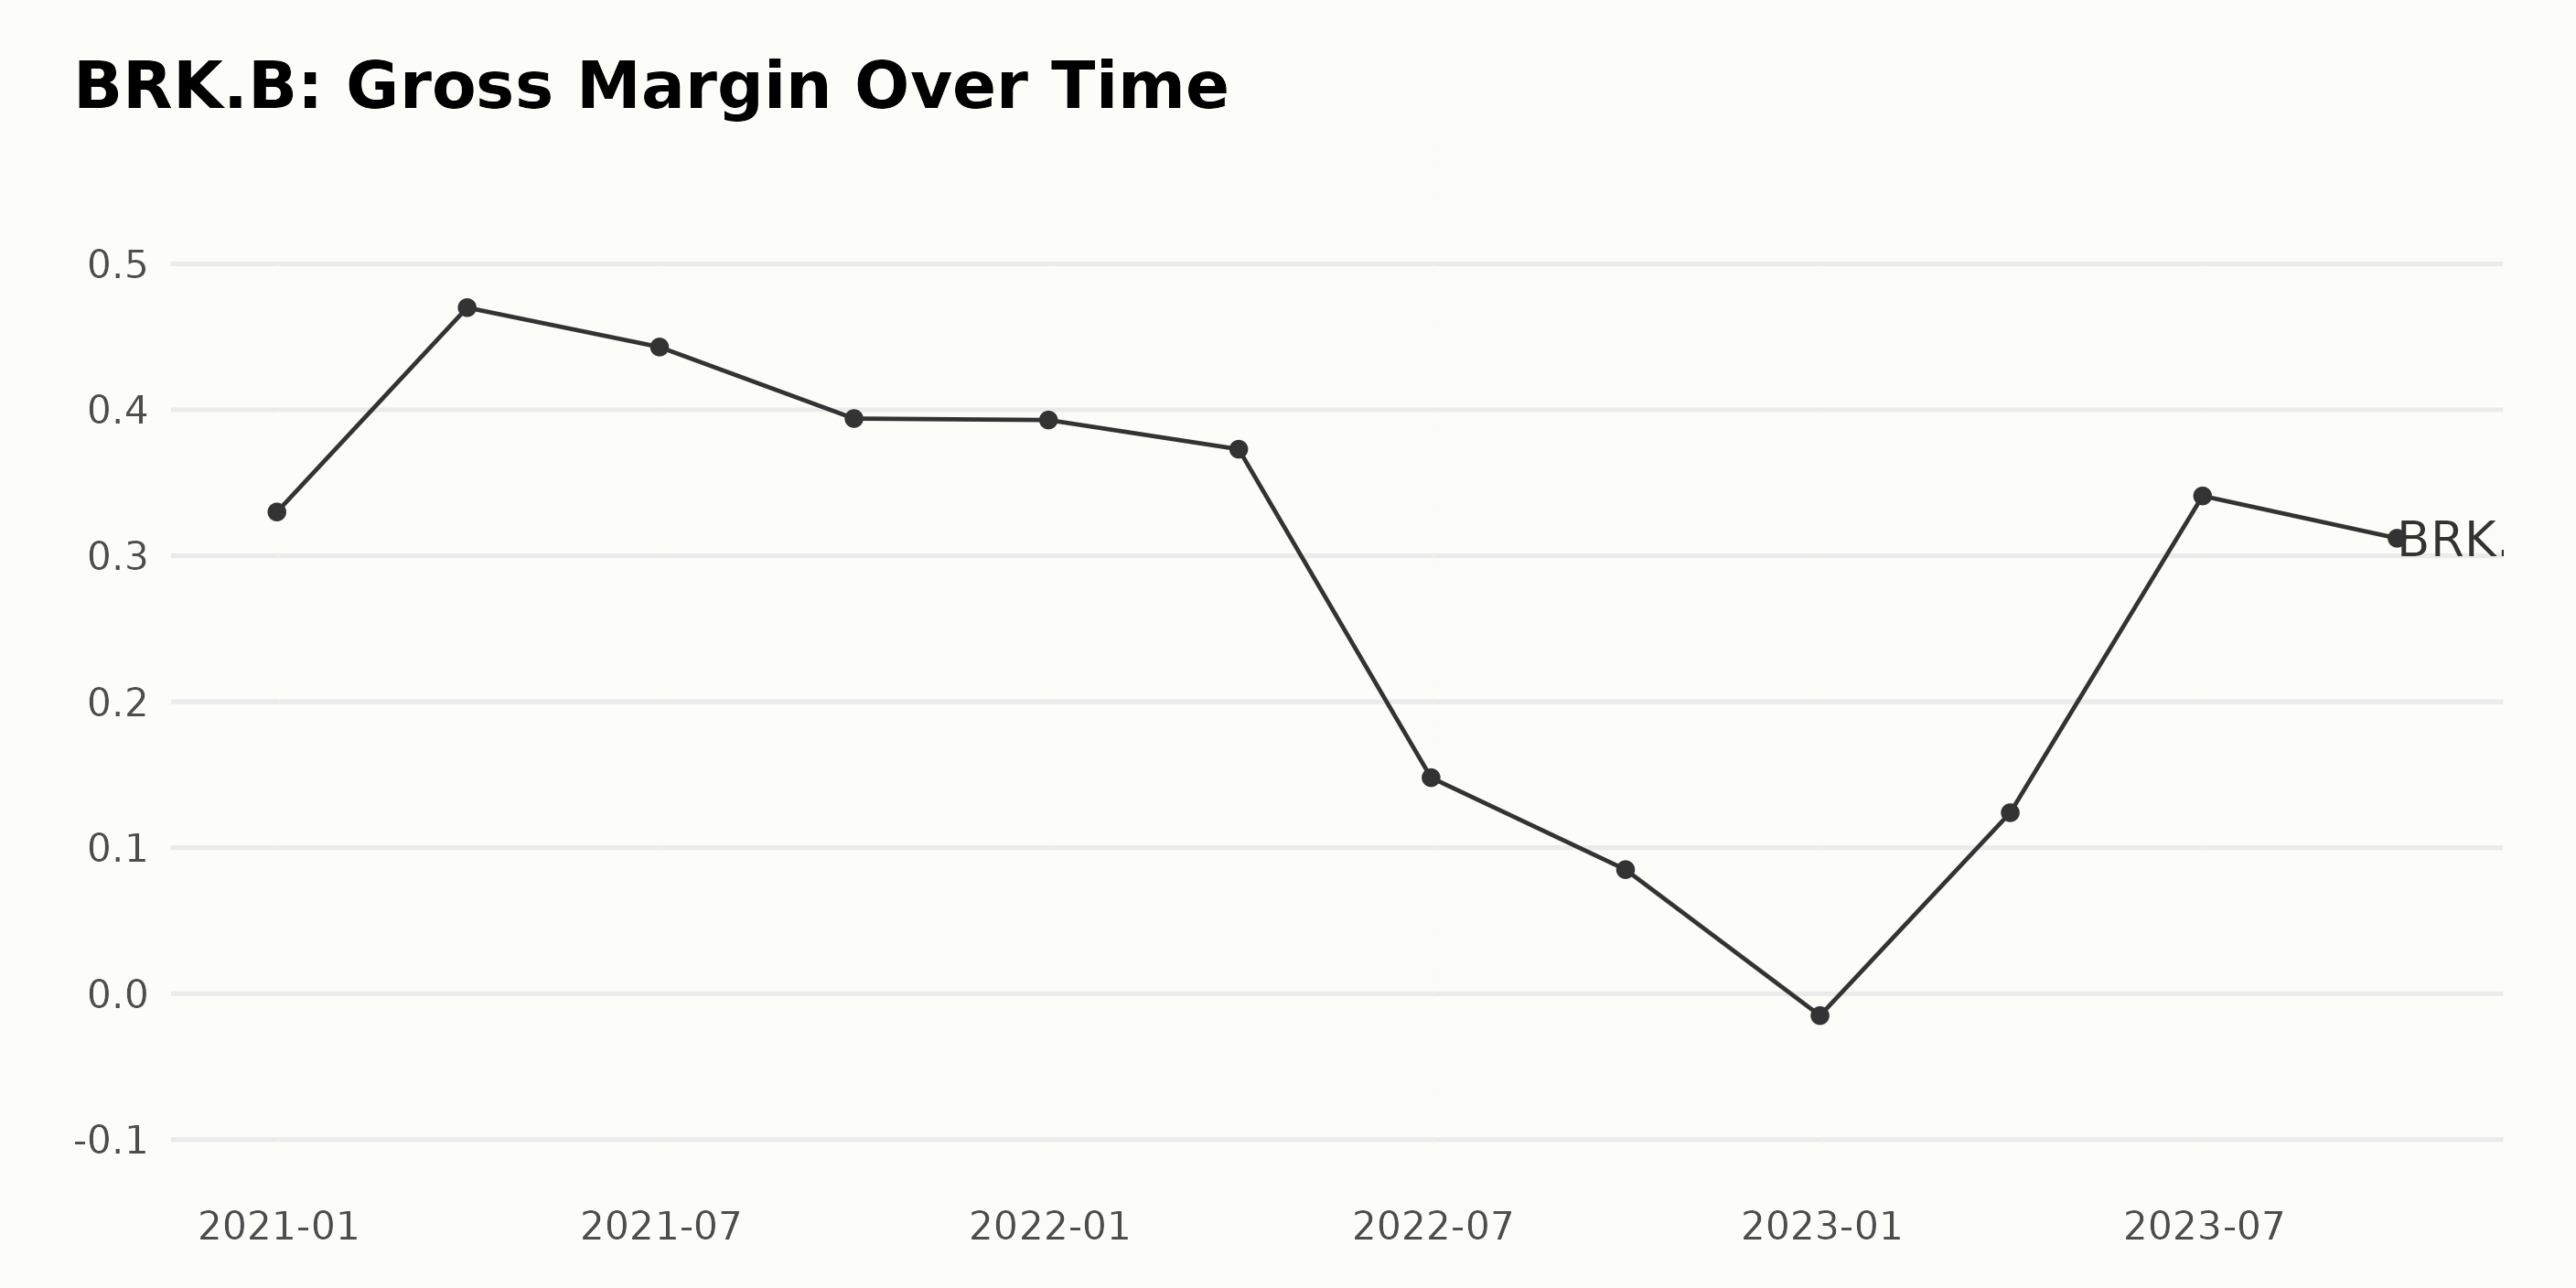
The gross margin of BRK.B has experienced significant fluctuations over the reported period. Key metrics include:
- December 31, 2020: The gross margin was at 33%.
- March 31, 2021: gross margin had a sharp increase to 47%.
- The next quarter, in June 2021, showed a slight decrease to 44.3%.
- From September 2021 to March 2022, there was a consistent decline, reaching as low as 8.5% by September 30, 2022.
- An unprecedented negative gross margin of -1.5% was observed on December 31, 2022.
- The year 2023 started with an improvement, with the first quarter reporting 12.4% and the second quarter at 34.1%, followed by a minor reduction to 31.2% by the end of the third quarter.
The data reveals that from December 2020 to September 2023, the company's gross margin has experienced considerable volatility. Calculating the growth rate from the initial value of 33% in December 2020 to the last reported value of 31.2% in September 2023, we see a growth reduction rate of approximately -5.45%.
This indicates a drop in gross margin over the observed period despite occurrences of interim recoveries. The latest data, while indicating an improving trend, is still lower than the starting point of this series. As recent data holds more significance, these recent improvements are definitely a positive sign for BRK.B.
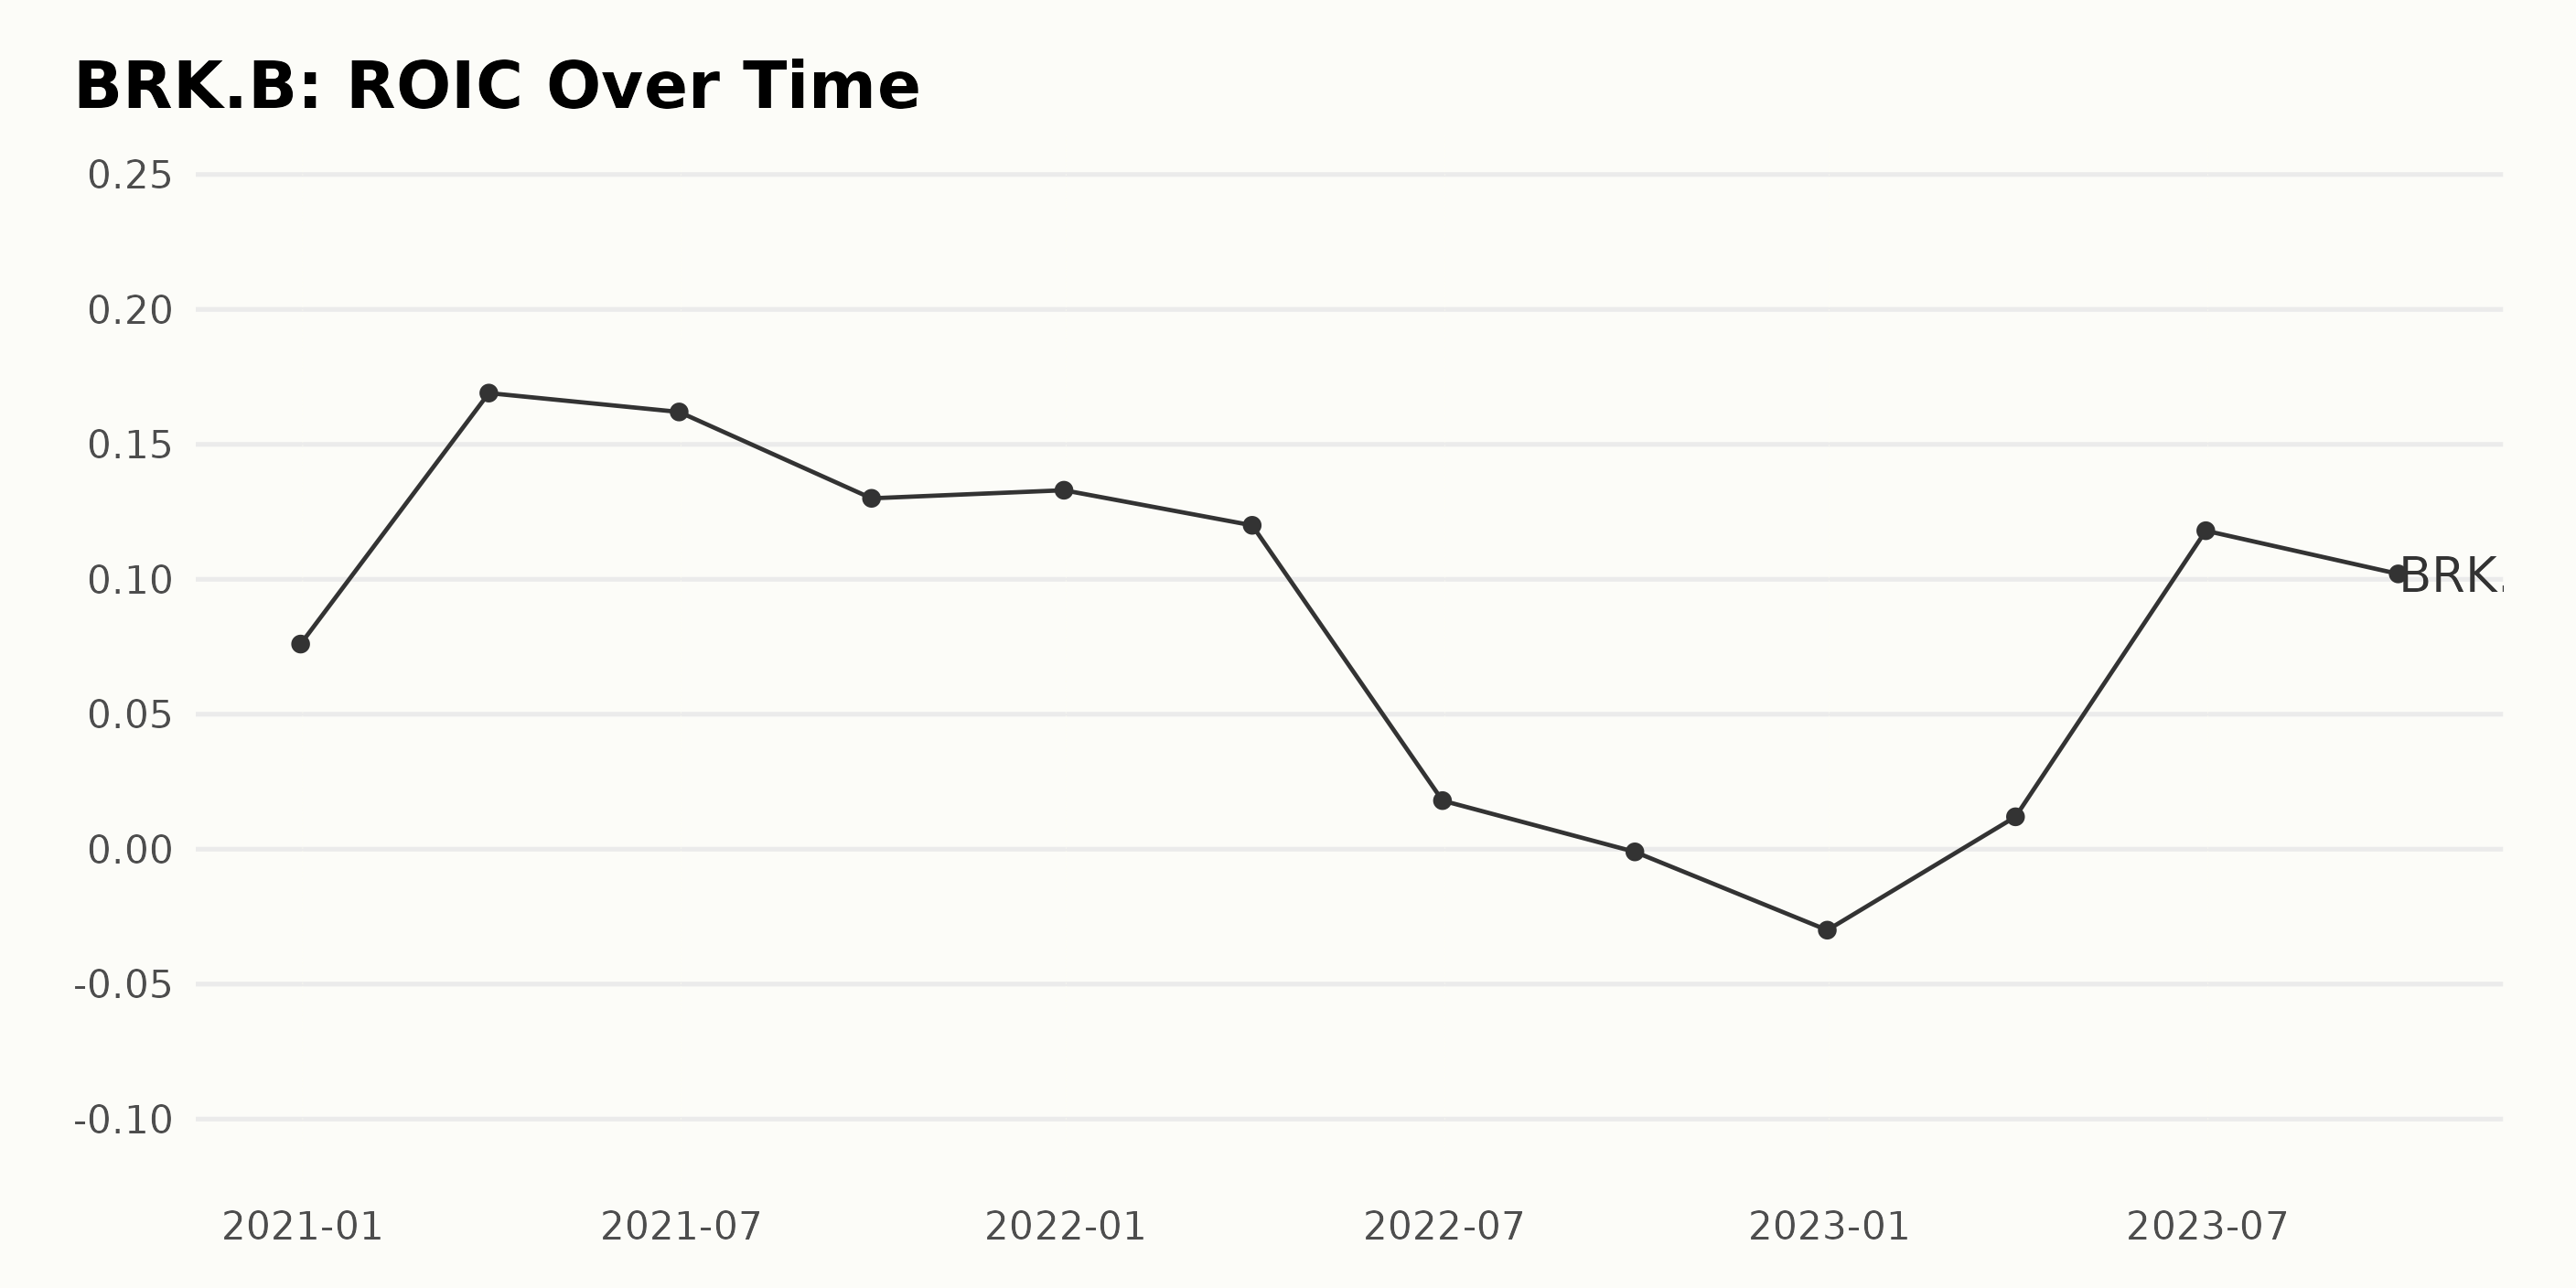
BRK.B’s Return On Invested Capital (ROIC) has seen significant fluctuation over the observed period. Here's a summary of the key points:
- On December 31, 2020, the ROIC stood at 7.6%.
- In the first quarter of 2021, there was a significant uptick to 16.9% by March 31, which by the end of the second quarter (June 30, 2021) dipped slightly to 16.2%.
- A downward trend was observed in the third quarter of 2021, with the ROIC dropping to 13.0% in September and slightly increasing to 13.3% by the end of the year (December 31, 2021).
- In the first quarter of 2022, the ROIC decreased to 12.0%, followed by a sharp drop in the second quarter to 1.8% by June 30, 2022.
- A deviation from the normal trend was recorded by the end of the third quarter of 2022, where the ROIC reached into the negative territory (-0.1%) for the first time, worsening to -3.0% by the end of the year (December 31, 2022).
- In 2023, a trend reversal was experienced with a positive ROIC of 1.2% as of March 31 and saw a substantial rise to 11.8% by June 30. The ROIC decreased marginally to 10.2% by the end of the third quarter (September 30, 2023).
Over this period, from December 31, 2020, to September 30, 2023, the ROIC has seen a growth of approximately 34.22% (from 7.6% to 10.2%). However, it is important to note that there were periods of significant fluctuations, including a descent into negative territory in the third and fourth quarters of 2022.
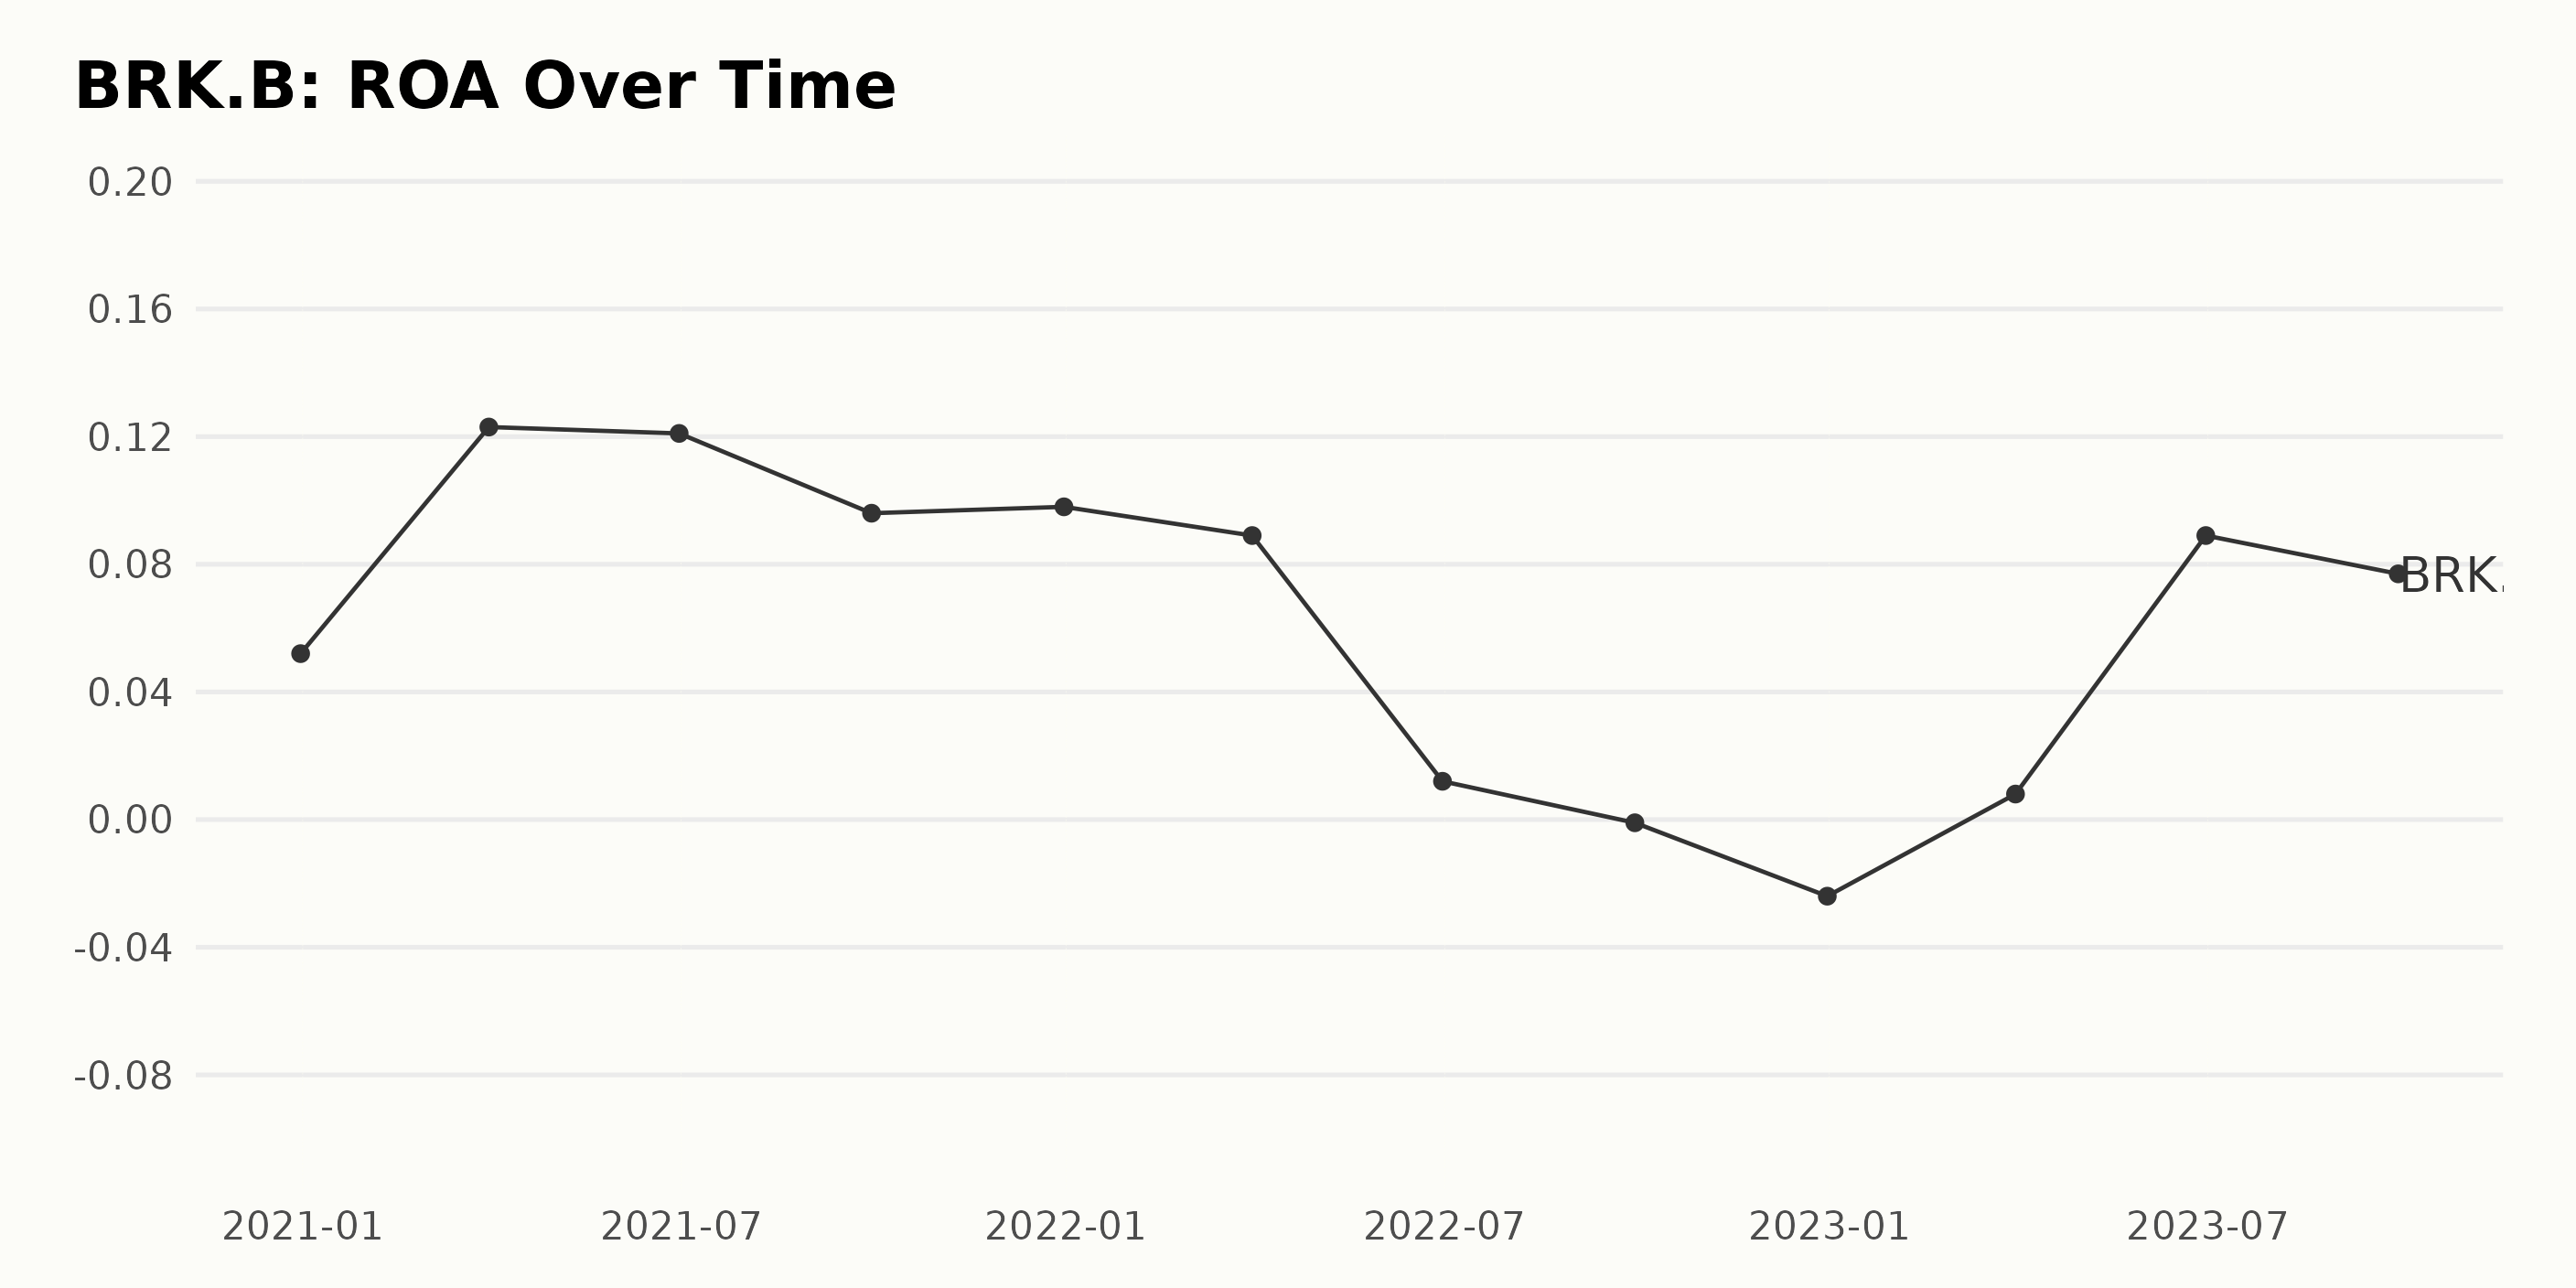
The data reflect the Return On Assets (ROA) of BRK.B over a period spanning from December 31, 2020, to September 30, 2023.
- At the start of the observed period, the company's ROA was 0.052 as of December 31, 2020.
- The ROA saw a substantial increase, reaching a value of 0.123 by March 31, 2021.
- Since then, the ROA experienced moderate fluctuations. It made a slight drop to 0.121 by June 30, 2021, and then further dropped to 0.098 by December 31, 2021.
- Throughout 2022, the ROA underwent a noticeable decline. A low point was reached on December 31, 2022, where the ROA fell into negative territory at -0.024. This indicates a loss-making period for BRK.B.
- However, the company managed to reverse this trend, and by March 31, 2023, the ROA improved to 0.008.
- This positive trend continued, reaching a value of 0.089 by June 30, 2023, and slightly decreasing to 0.077 by September 30, 2023, the end of the observed series.
In terms of the overall growth rate calculated by measuring the final value from the first one, the series records a 25% increase from the initial period to the final period. However, recent trends indicate more volatile periods for the company, given the fluctuations in ROA over time.
Analyzing Berkshire Hathaway's Share Price Fluctuations from May to November 2023
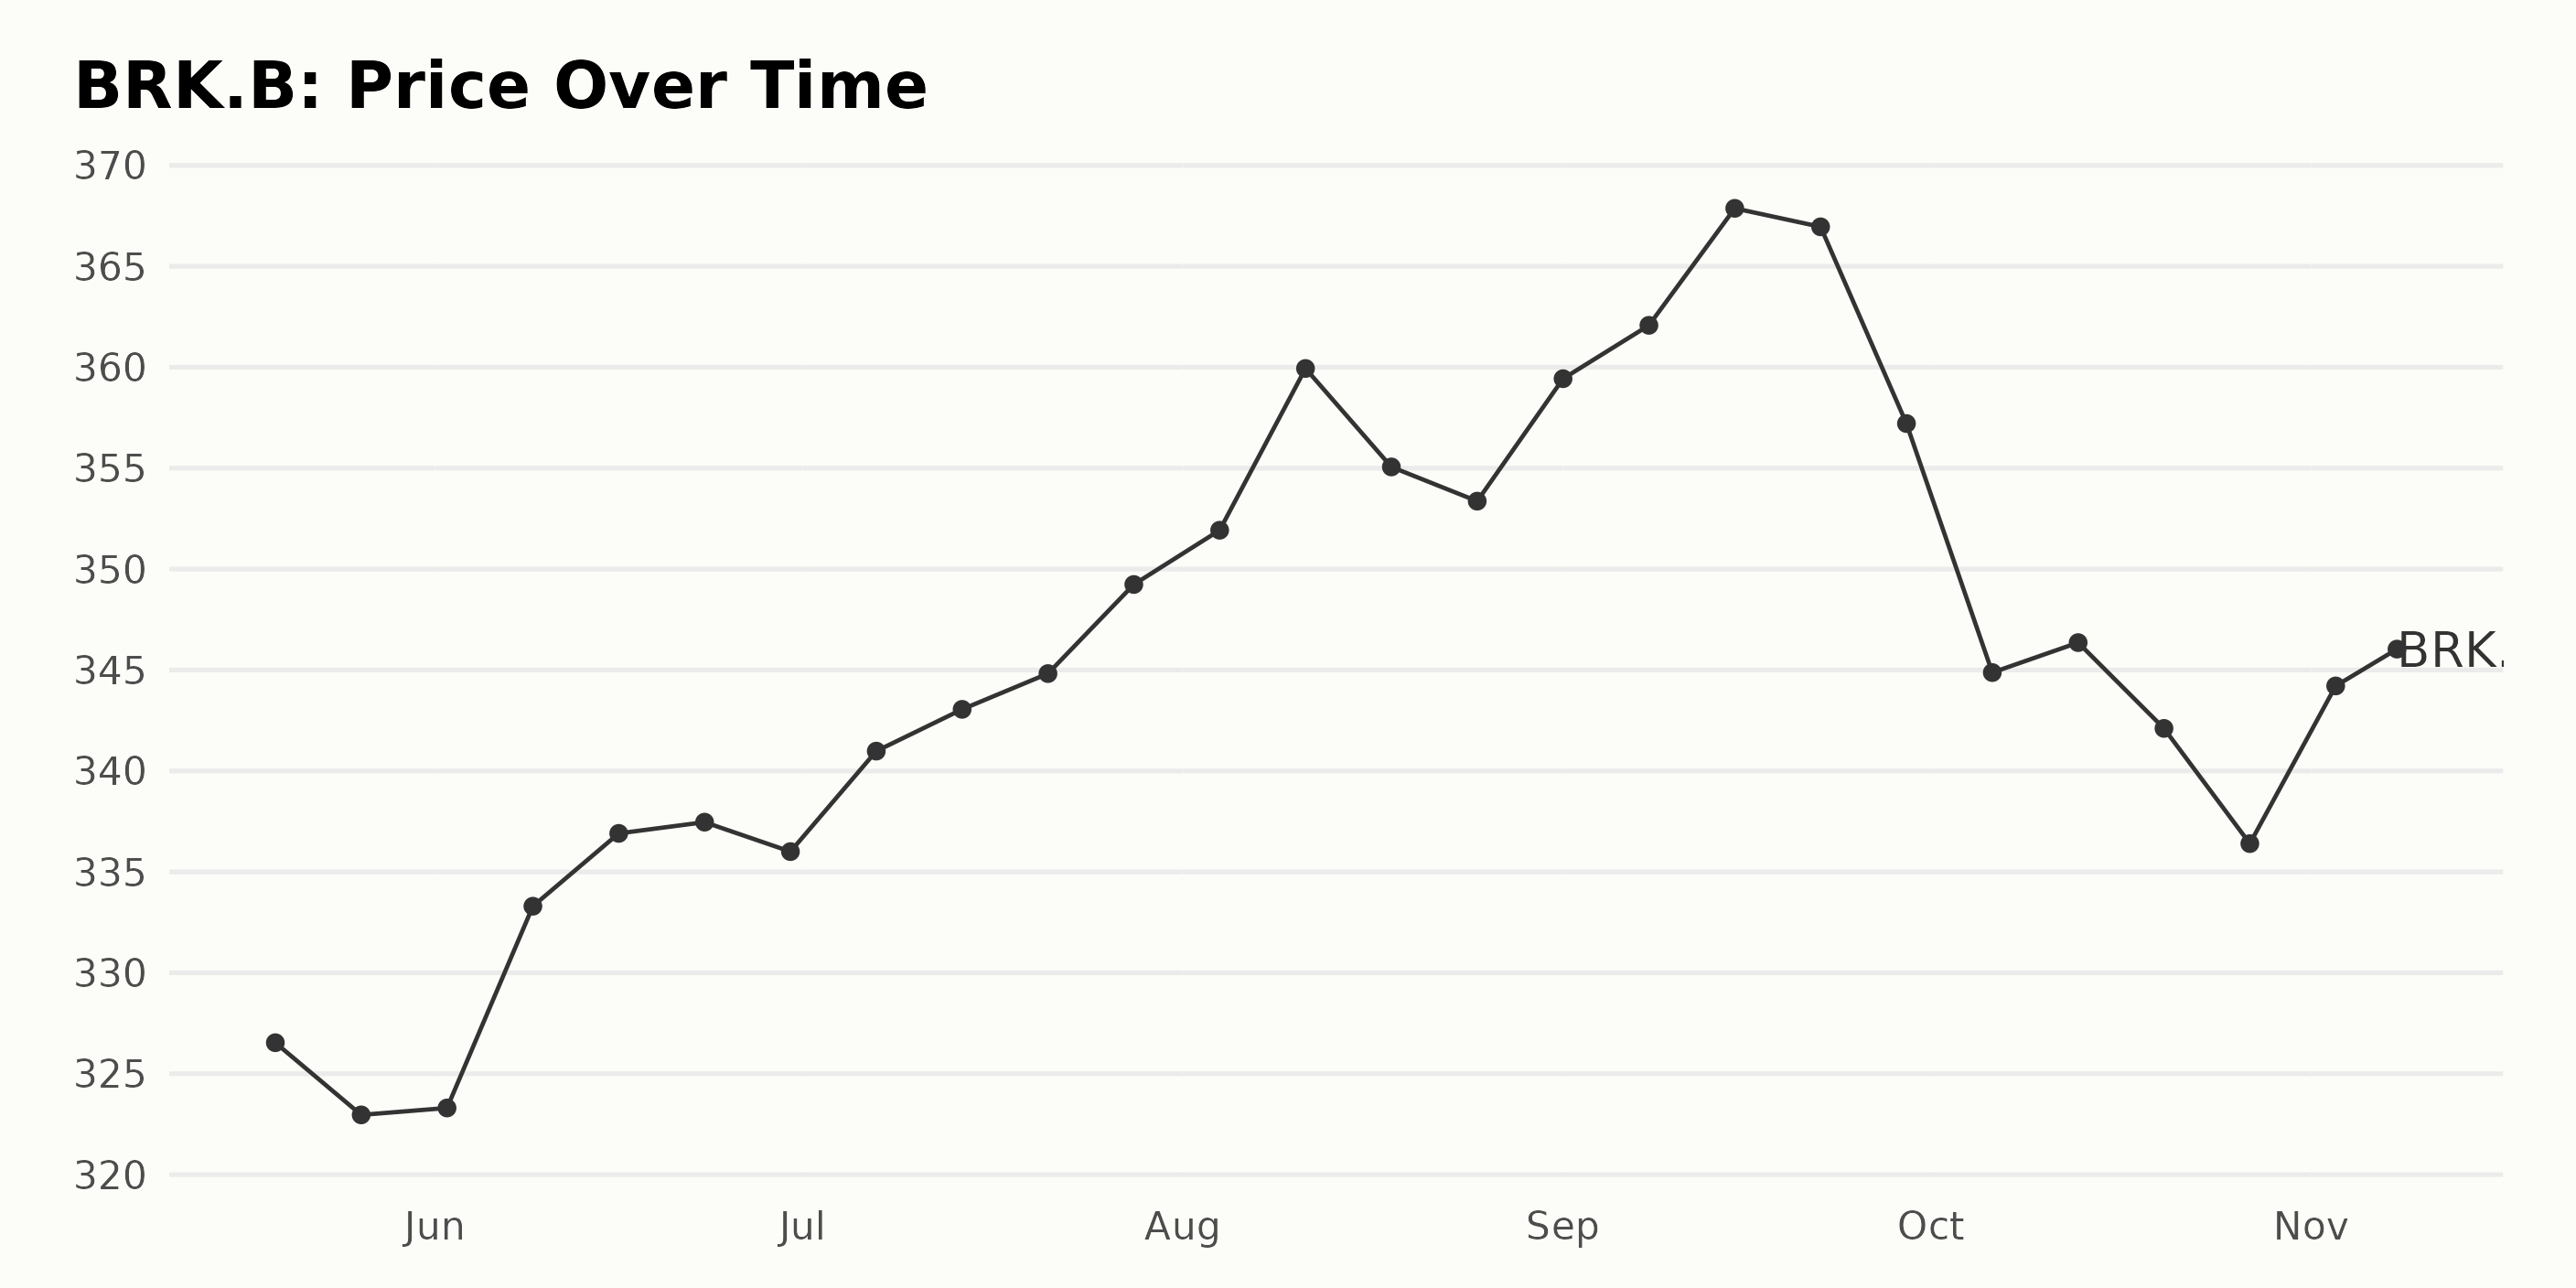
The data describes the weekly trend in BRK.B share prices from May 19, 2023, to November 8, 2023. The analysis shows a general upward movement with some fluctuations in between:
- On May 19, 2023, the share price was $326.54
- There was a brief dip the following week to $322.96 as of May 26, 2023.
- The price bounced back marginally by June 2, 2023, to $323.30, followed by a significant rise to $333.30 by June 9, 2023.
- A steady increase continued through June, reaching $336.91 and $337.46 on June 16 and 23, respectively. There was a slight decrease on June 30 to $336.00.
- In July, the growth trend resumed, hitting a peak of $349.24 at the end of the month.
- The highest observed value was $359.94, recorded on August 11, 2023.
- Though there were minor drops afterward, including a fall to $353.37 on August 25, the price rose again to $367.87 on September 15, 2023, before another slight decline.
- From late September, a decelerating trend is seen, with the share price falling to $344.21 as of November 3, 2023.
- By November 8, 2023, the share price experienced a minor rise to $346.30.
In summary, from May to November 2023, BRK.B stock prices generally increased, but this growth rate decelerated toward the end of the observed period. Here is a chart of BRK.B's price over the past 180 days.
Analyzing Berkshire Hathaway's 2023 Performance: Momentum, Sentiment, and Stability Overview
The POWR Ratings Grade for the stock BRK.B, which is in the Insurance - Property & Casualty category of stocks, has recently undergone changes. Here's a summary regarding its standing on different dates:
- On May 13, 2023, the POWR Grade was C (Neutral), and it ranked #39 within its category.
- The stock maintained a C (Neutral) POWR Grade throughout May and June, with a slight improvement in its category rank, which moved from #39 to #34 by the end of June 2023.
- In July 2023, the stock persisted with a C (Neutral) grade, fluctuating slightly between ranks #35 and #32 by the month's end.
- August 2023 saw an improved ranking of #24 at one point but ended with the stock at rank #25 in its category, maintaining the C (Neutral) POWR Grade.
- The first significant change occurred at the end of September 2023, when the POWR Grade elevated to a B (Buy), while its rank further improved, reaching #21 in the category.
- The B (Buy) POWR Grade prevailed throughout October 2023, and the stock's category rank remained relatively stable, only climbing to #20 briefly on October 7, 2023.
- By November 9, 2023, the latest data available, the POWR Grade reverted to C (Neutral), but the stock sustained its improved position within the category, ranking #20 out of the total 56 stocks.
Though BRK.B's POWR Grade has varied over time between C (Neutral) and B (Buy), and it falls nearer the middle of the pack in its category, these changes signify a dynamic market performance.
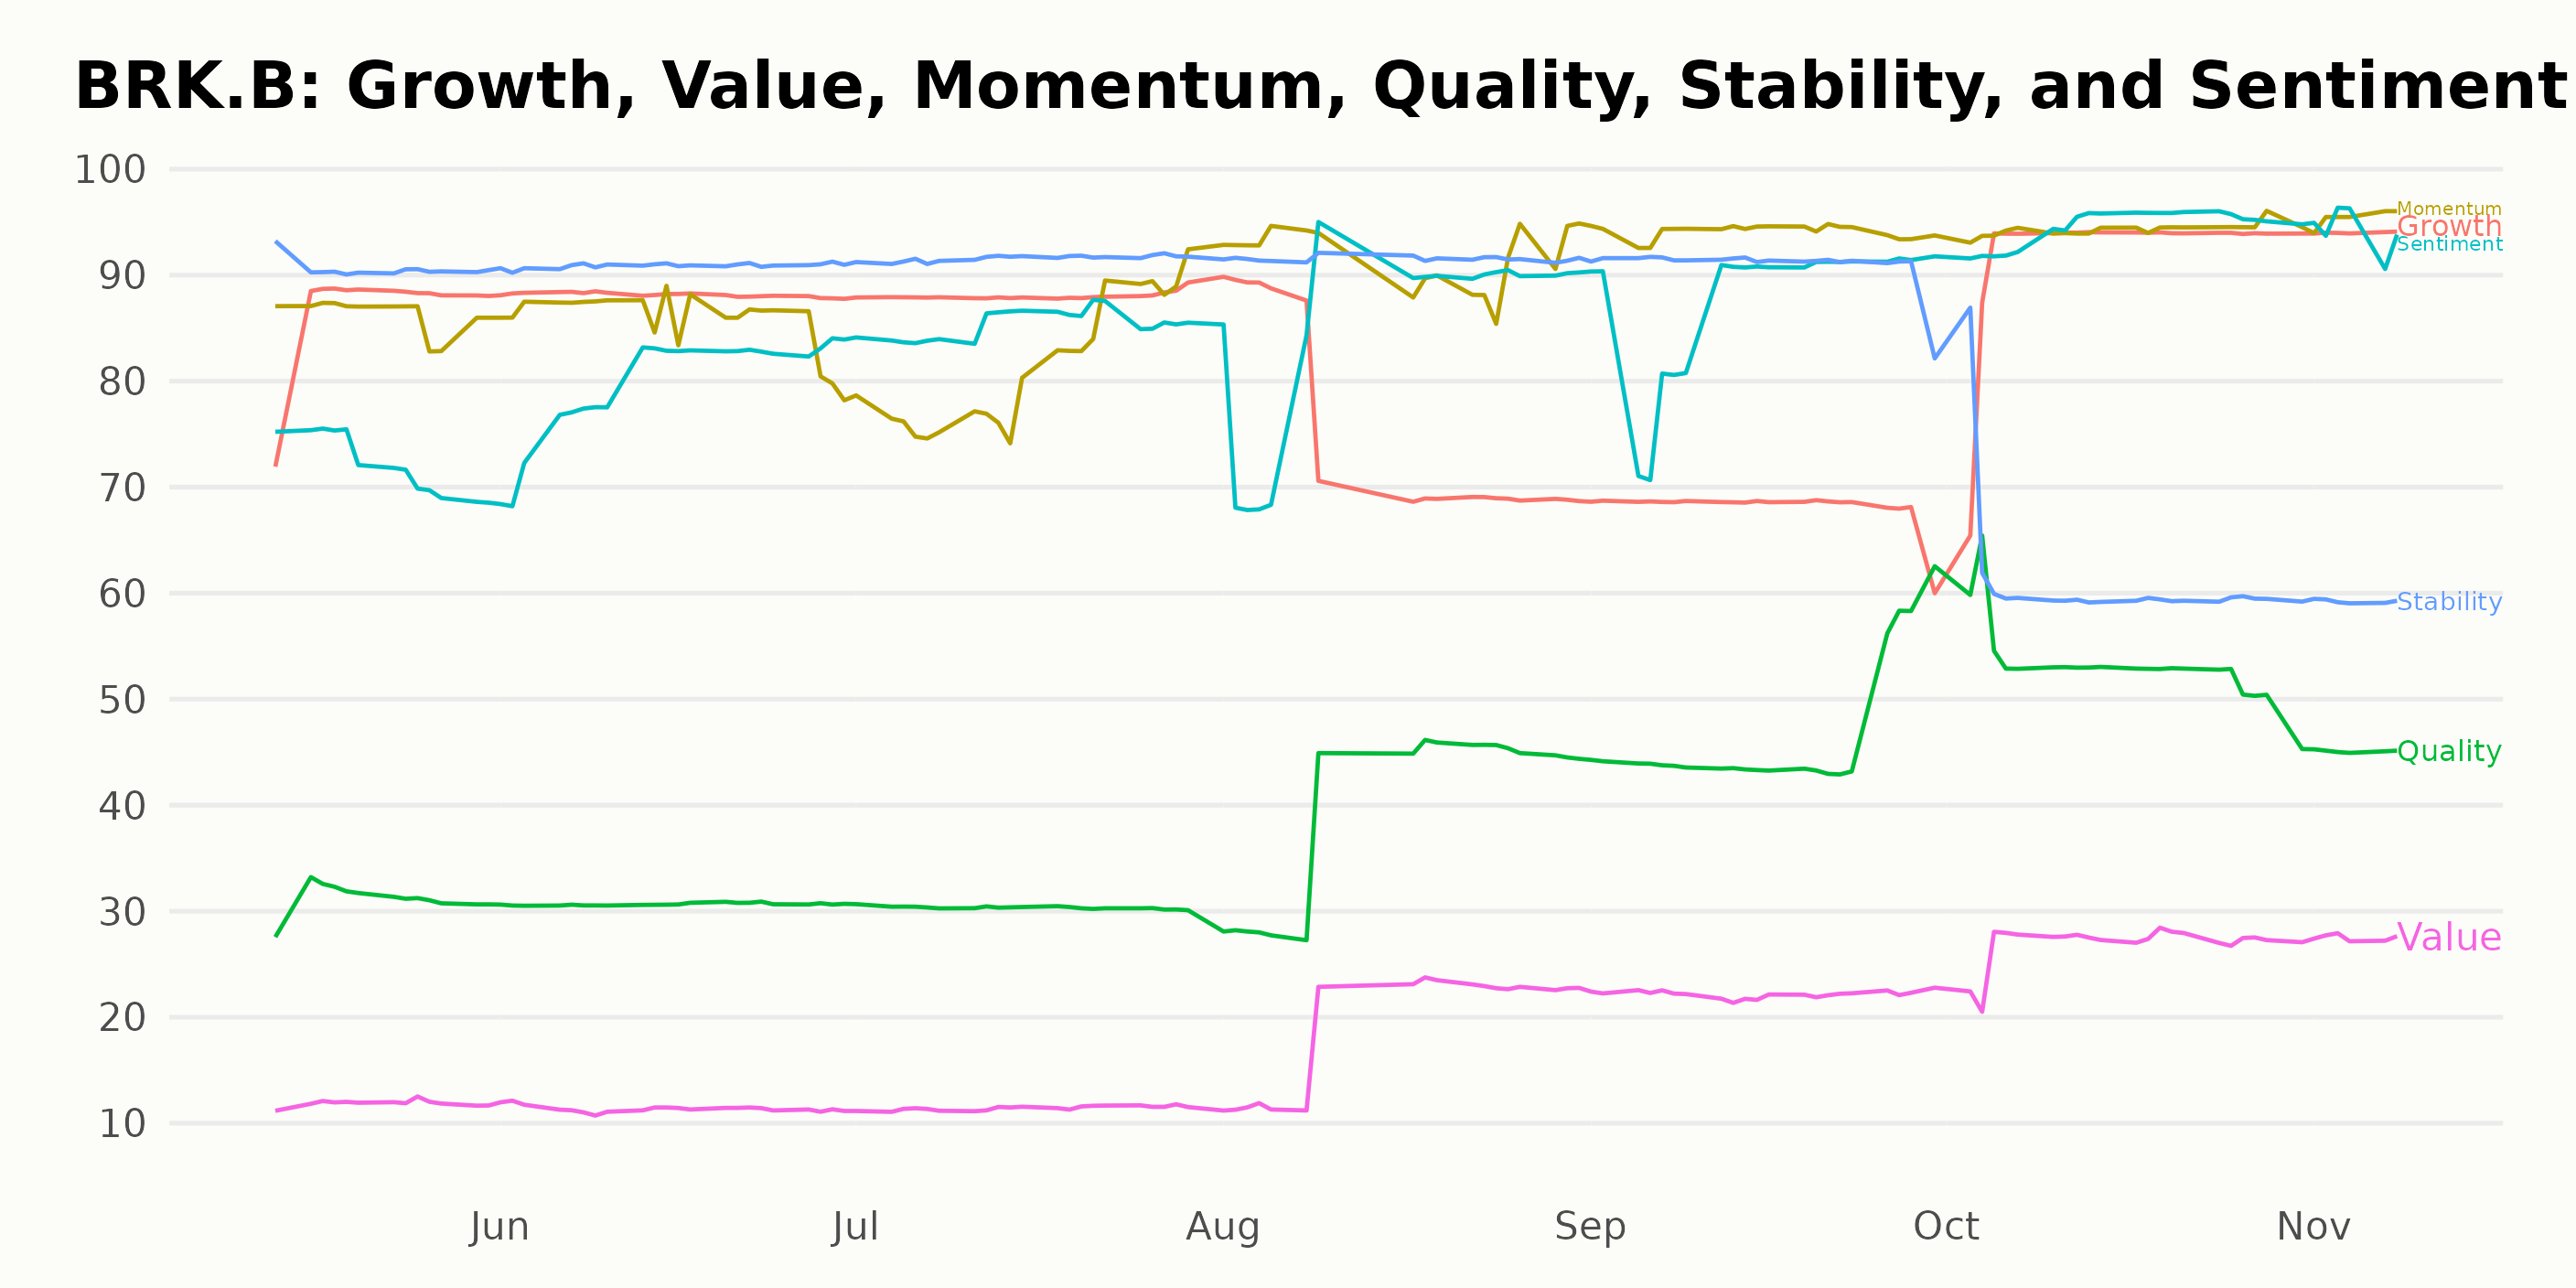
Throughout 2023, the key POWR Ratings dimensions for BRK.B were Momentum, Sentiment, and Stability. These three metrics have depicted noteworthy patterns and findings. Here are their detailed overviews:
Momentum
- In May 2023, the Momentum score was 86.
- It remained stagnant at 86 in June before declining to 81 in July 2023.
- After a significant increase to 92 in August, it continued its upward trend, reaching 94 in September and maintaining the same in October.
- By November 8, 2023, the Momentum had slightly increased to a score of 95.
Sentiment
- The Sentiment dimension started with a score of 72 in May.
- There was an upward trend noticed as it escalated to 80 in June, 85 in July, and remained constant at 85 through August 2023.
- It saw further growth in September with a score of 88, followed by the highest score of 95 in October 2023.
- The rating slightly declined to 94 by November 8, 2023.
Stability
- Stability holds the highest scores among the dimensions, with 91 in May, before a small increment to 92 in July, which held up until August.
- However, there was a notable decline in the stability score to 91 in September, dropping further to 61 in October and 59 by November 8, 2023.
In conclusion, while Momentum and Sentiment showed a generally increasing trend throughout the period, Stability experienced a significant decline towards the end of 2023.
How does Berkshire Hathaway Inc. (BRK.B) Stack Up Against its Peers?
Other stocks in the Insurance - Property & Casualty sector that may be worth considering are The Hartford Financial Services Group, Inc. (HIG), MS&AD Insurance Group Holdings, Inc. (MSADY), and Loews Corporation (L) - they have better POWR Ratings. Click here to explore more Insurance - Property & Casualty stocks.
What To Do Next?
Get your hands on this special report with 3 low priced companies with tremendous upside potential even in today’s volatile markets:
3 Stocks to DOUBLE This Year >
BRK.B shares were trading at $350.11 per share on Thursday afternoon, up $3.81 (+1.10%). Year-to-date, BRK.B has gained 13.34%, versus a 15.72% rise in the benchmark S&P 500 index during the same period.
About the Author: Anushka Dutta

Anushka is an analyst whose interest in understanding the impact of broader economic changes on financial markets motivated her to pursue a career in investment research.
The post Is Berkshire Hathaway (BRK.B) a Buy After Earnings? appeared first on StockNews.com