


 A bull flag is an uptrend continuation chart pattern in the stock market or an individual stock that signals that a bullish trend is likely to persist. Traders and investors use bull flags to identify a potential entry into the next leg of an uptrend. When traders use the phrase, "Wait for a pullback," they are often referring to the conditions that form a bull flag.
When you enter a bull flag pattern, you are never chasing the top. Instead, you're waiting patiently for the pullback to complete and enter the breakout trigger. In this article, we'll dissect the pieces of a bull flag so you can identify them and review how to trade them.
Characteristics of a Bull Flag Pattern
A bull flag pattern can be seen as two rallies in a stock separated by a pullback in between. It indicates an initial buying frenzy that spikes the price of the stock, which then takes a rest as it sells off before surging again as buyers rush back into the stock.
Formation of the Bull Flag
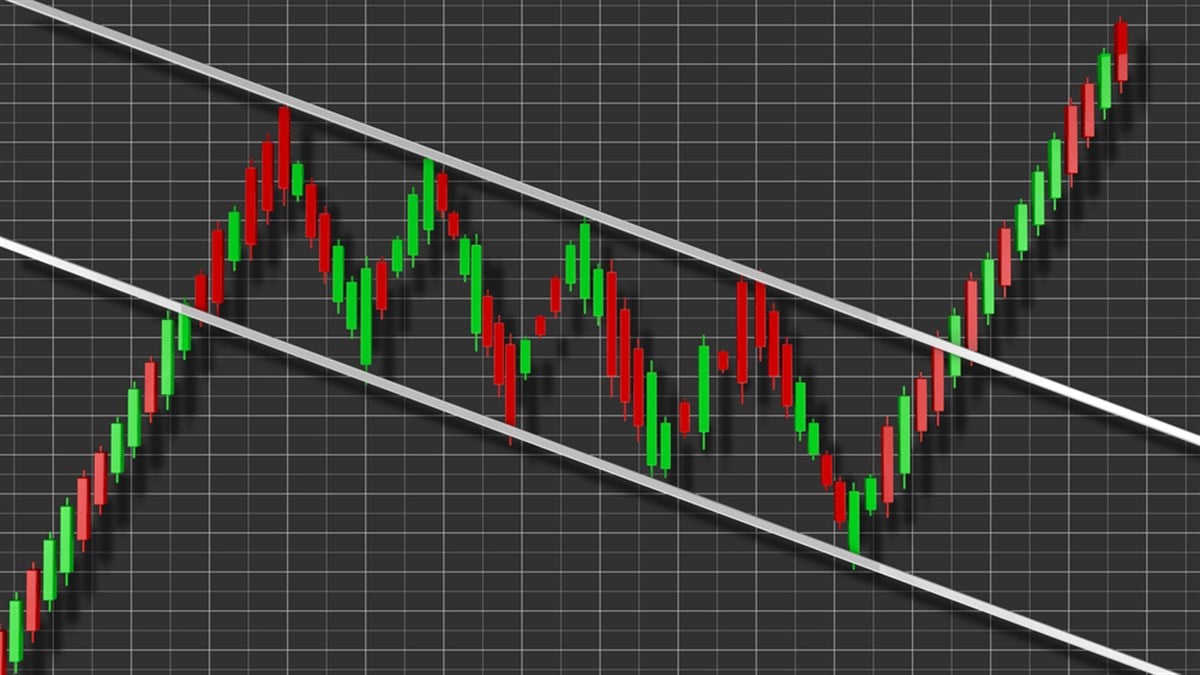
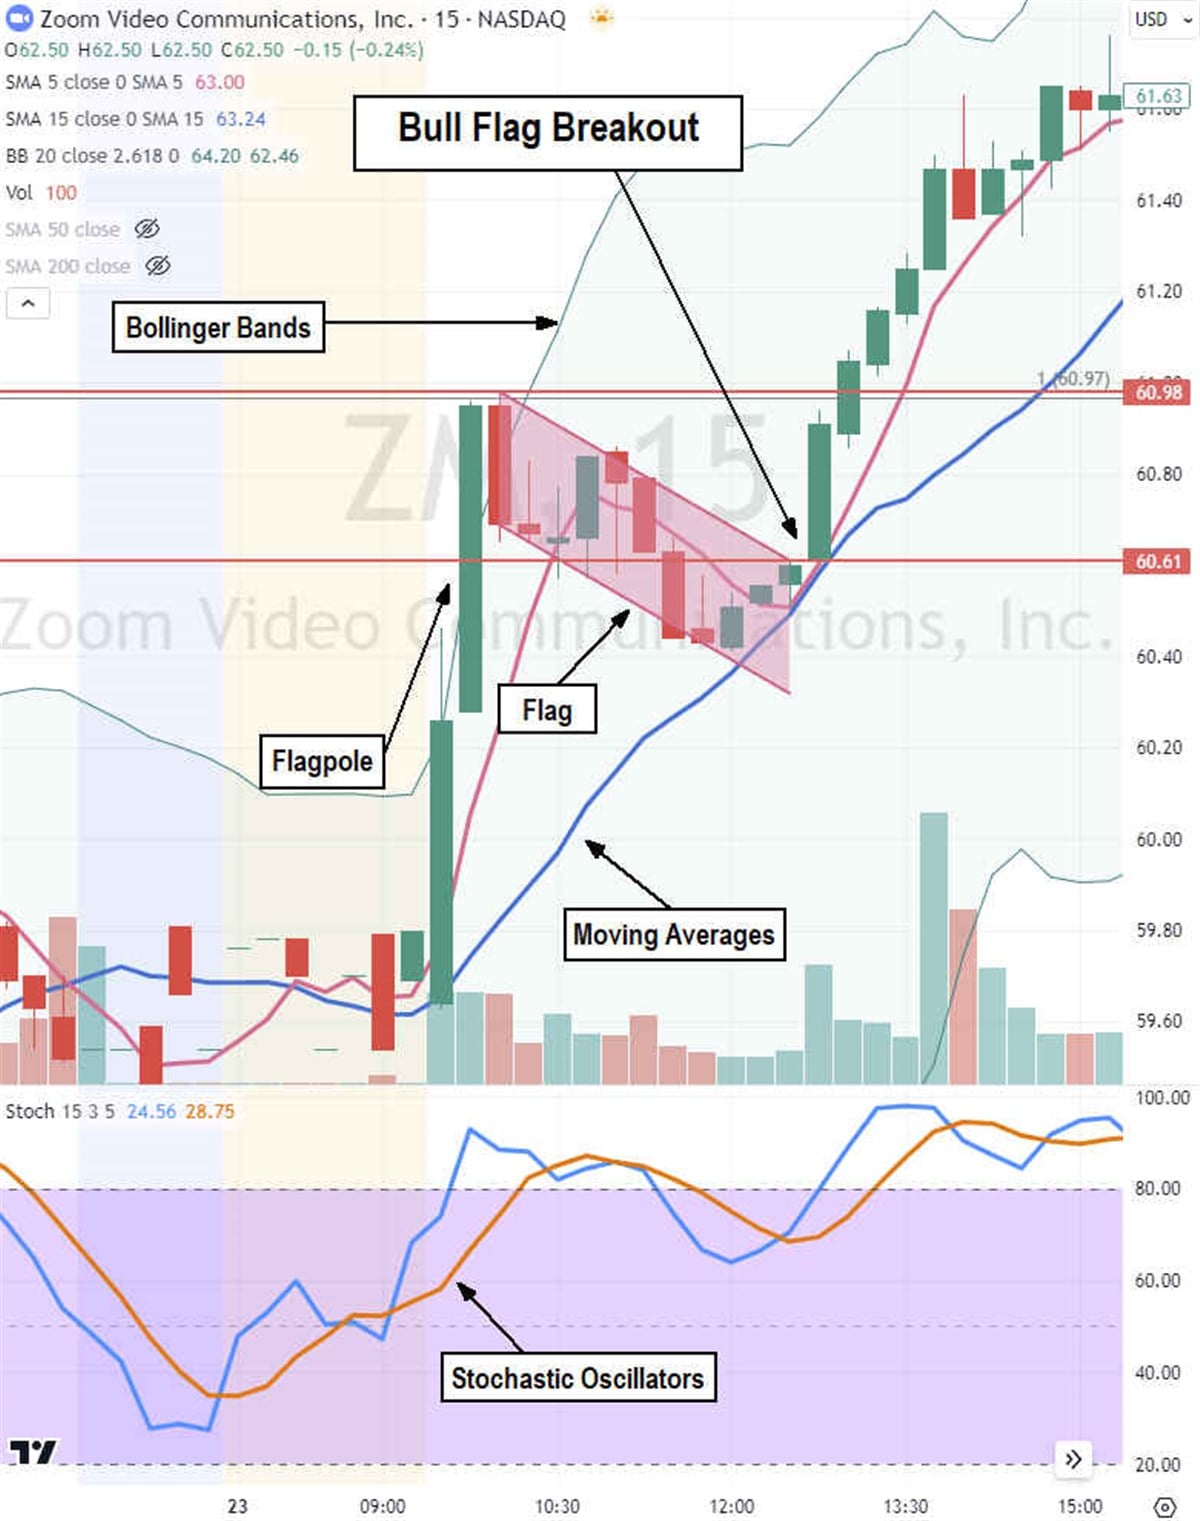
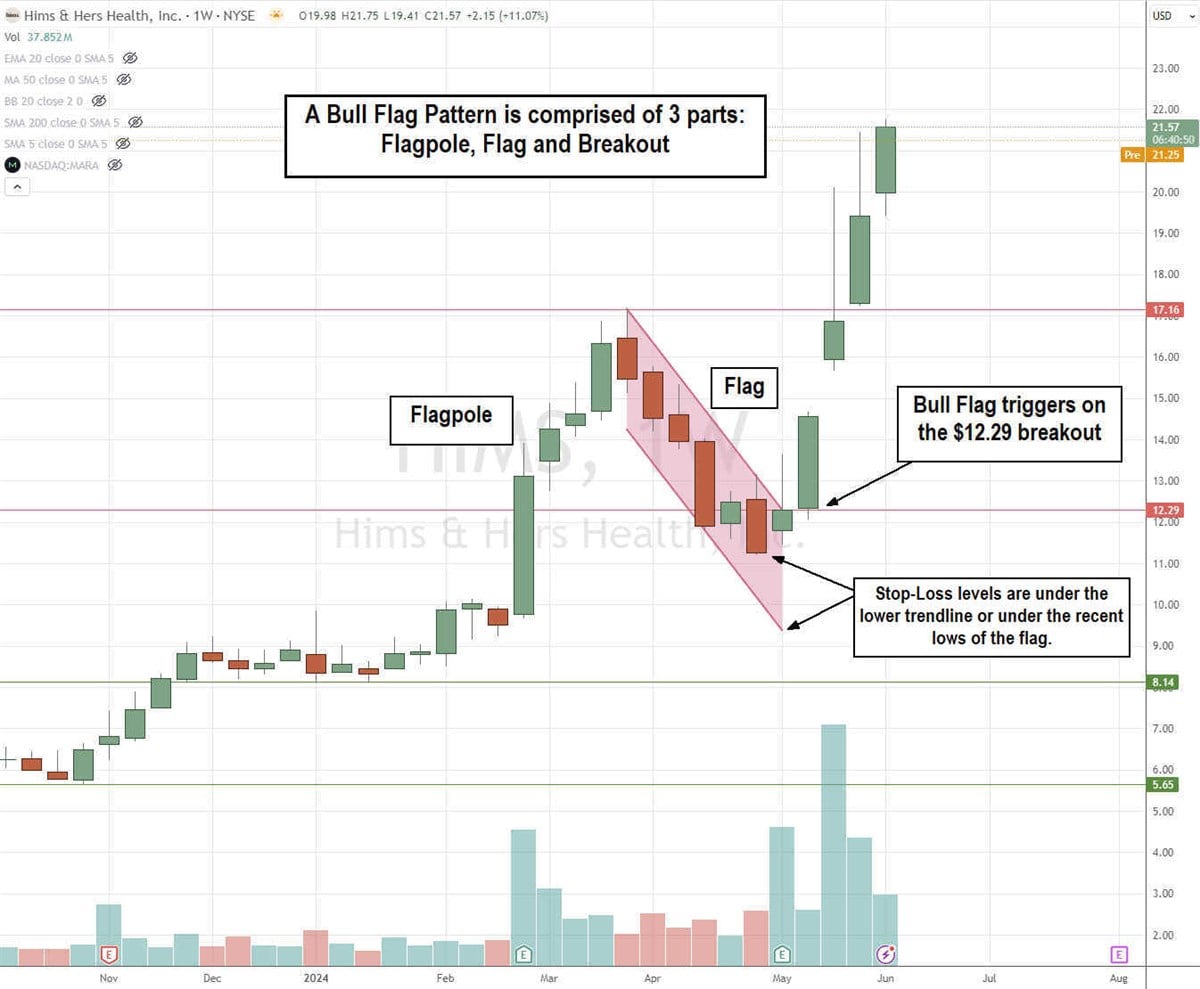
A bull flag is a stock chart pattern comprised of three parts: the flagpole, the flag, and the breakout. The flagpole, sometimes called an impulse wave, is a parabolic stock price rise and signals the start of a bullish trend. After the spike peaks, it forms a consolidation phase known as the flag. This pullback consists of a series of lower highs and lower lows in a parallel manner, representing the upper and lower descending trendlines. The pattern culminates in a breakout where the price exits the flag pattern and surges through the upper trendline resistance.
Technical Indicators
Bull flag patterns are best identified on a candlestick chart. You can also use various technical indicators to identify, visualize, and confirm them. Some popular analysis tools include price indicators like moving averages and Bollinger Bands and momentum indicators like the relative strength index (RSI), moving average convergence divergence (MACD) and stochastic oscillators.
Remember that bull flag patterns are linear through all time frames. This means they can form on any time frame chart from a one-minute, five-minute, 15-minute, or 60-minute to daily, weekly, or monthly charts. Robust stock patterns, as a rule, should be linear in all time frames.
Tips for Trading the Bull Flag Pattern
Bull flag patterns provide opportunities to buy a long position in the underlying stock. As with all trades, it's prudent to plan your entry and exits, which include profit and stop-loss exits. You can also include a momentum indicator to confirm the breakout and momentum shift from selling to buying. The RSI is a great tool to confirm a breakout when it rises again.
Entry Points
To determine the entry points on a bull flag pattern, it’s important to make sure you have the proper parallel lines representing the upper descending and lower descending trendlines. The upper trendline is formed by connecting the candlestick highs starting from the peak of the flagpole. The lower trendlines are formed by connecting the lows of the candlesticks. The lines should be parallel. Many charting platforms have a drawing tool called “parallel channel” to plot these.
The entry point for a bull flag pattern is when the stock breaks out through the upper descending trendline. Therefore, the entry points are above the upper descending trendline as the price exits the flag formation. Try to enter as close to the breakout level as possible to increase the potential for gains.
Setting Stop-Loss and Take-Profit Levels
Once properly set up, the stop-loss level can be on a new lower low or under the lower trendline price of the flag. Taking a stop on the next lower low can cut losses much earlier than taking a stop under the lower descending trendline.
Profit taking levels can begin when the stock rises to the peak of the flagpole level or the high of the flagpole. After that, you can take profits incrementally utilizing various methods, including a momentum peak using the RSI or stochastic indicator or sell into the strength on a gap fill.
Advantages of Trading Bull Flag Patterns
Trading bull flag patterns offers several key advantages that make them a popular choice among traders. They have very distinct setups that can be rather easy to identify once you get used to spotting them. They have very distinct entry and exit levels. Most importantly, they are linear across all time frames, so they can occur frequently across stocks that trade in similar industries and sectors. When a benchmark index forms a bull flag pattern, it can trigger across many stocks simultaneously. As the saying goes, "When it rains, it pours."
Predictability and Reliability
The predictability and reliability of bull flag patterns are subjective, so when it comes to bull flags, the most important thing to do is react, not predict. Bull flag patterns are known to be particularly effective in bull and rising markets, offering reliable continuation signals. When they break out through the peak of the flagpole, it means the next leg of the uptrend.
Risk-Reward Ratio
The risk-reward ratio can vary depending on the specific trade. Ideally, you should aim for a 1:2 risk-to-reward ratio when trading a bull flag breakout, i.e. a $1 gain for every 50 cents risked on a stop-loss. This helps in identifying quality setups. However, in some cases, a 1:1 ratio may be acceptable if the probability of making the profit is 90% or higher. This assessment can be enhanced using multiple indicators and time frames for a Doppler radar effect.
Common Mistakes to Avoid
You can improve your bull flag trading strategy by understanding and avoiding these common mistakes:
Misidentifying the Pattern
Bull flags can be misidentified, especially if they are missing any of the three necessary parts of the formation, including the flagpole (parabolic price surge), the flag (parallel descending trendlines) and the breakout (price surges through the upper descending trendline). If the flagpole peaks but forms a drop and higher lows against a flat-top high, this is an ascending triangle pattern. If the flagpole peaks and then forms lower highs and higher lows, this may be a pennant pattern. While these are bullish patterns, they aren't bull flags.
Ignoring Market Context
Ask yourself, would it be easier to light a campfire during a rainstorm or a sunny day? Context makes a huge difference. The same applies to the stock market. Bull flag patterns work best in bull markets, so be sure to take advantage of rising markets and train yourself to spot bull flags, but also be frugal in falling markets.
Example of a Bull Flag Pattern
Let's take a look at a bull flag breakout in medical sector stock Teva Pharmaceutical Industries Ltd. (NYSE: TEVA), a leading manufacturer of generic and biosimilar medicine.
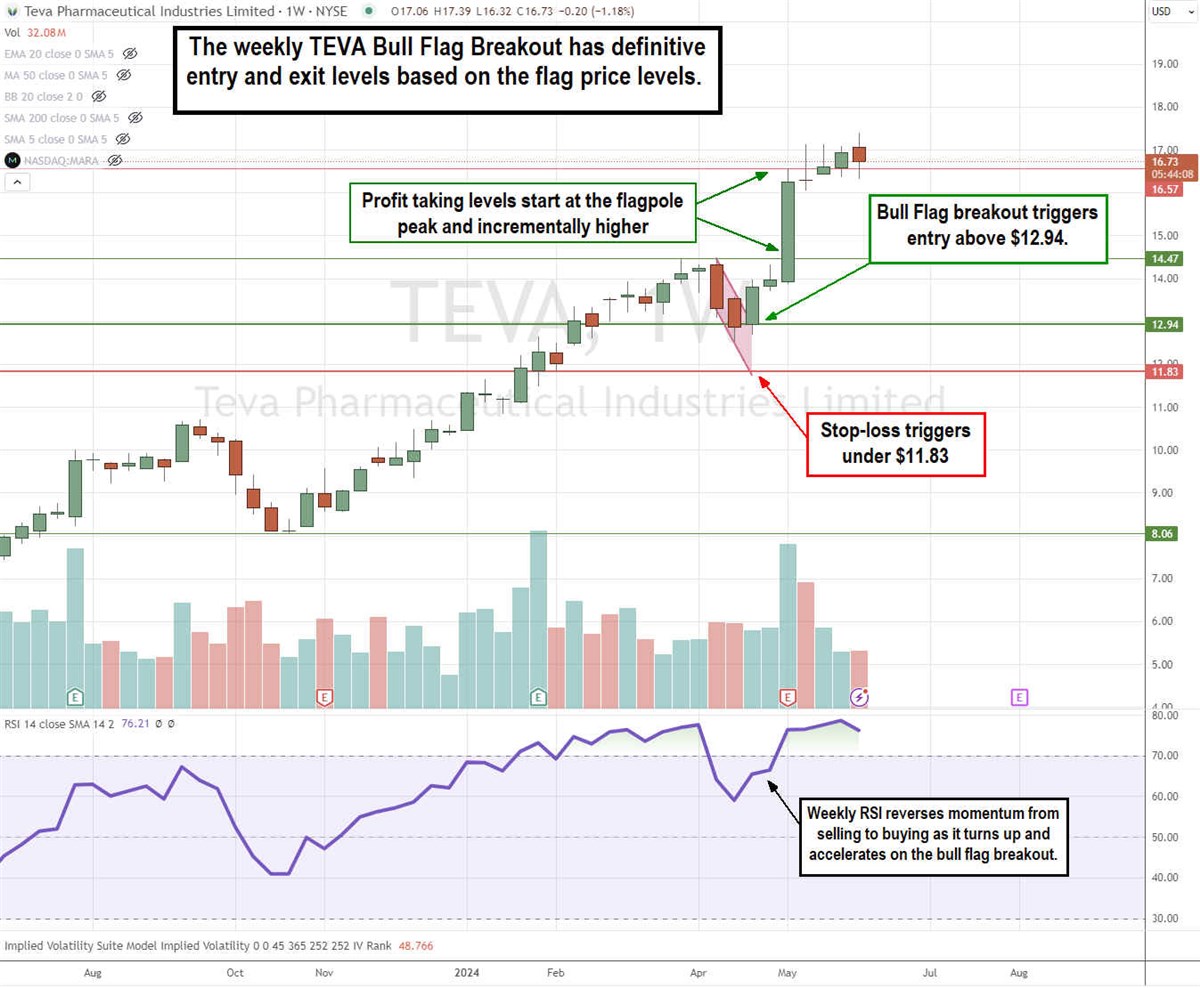
The weekly candlestick chart on TEVA illustrates a bull flag breakout. The flagpole forms from a swing low of $8.06 on October 23, 2023, rising to a peak at $14.47 on April 8, 2024. The flag forms from the $14.47 peak as it falls in parallel lower highs and lower lows, reaching a low of $12.51. The RSI fell from the overbought 78-band down to the 60-band, where it bounced with the stock. TEVA formed a breakout through the flag’s upper trendline at $12.94 on April 22, 2024. This triggered the entry long. The stop-loss at the break of the lower trendline would be under $11.83. The weekly RSI bounced back up through the 70-band as TEVA bounced back up through the $14.47 flagpole high. TEVA surged to $16.64 on its earnings release and continued to grind higher to a peak of $17.39 as the next leg continued the uptrend.
Plan Your Trade and Trade Your Plan
Whether you’re a trader or an investor, having a plan is always prudent before clicking the buy button. Bull flags present opportunities to enter or reenter an uptrending stock. However, it would be best to lay out the fundamental and technical reasons for entering the trade ahead of time. Don't predict the breakout; wait for it to occur and then react with your entry. Once you have entered your position, it's important to have the discipline to take profits and stop losses as they occur. Don't let a small loss turn into a larger one; stops are a pause in your trading, not the end. As a rule of thumb, it's wise to raise your stop loss levels as the stock rises. And remember: not all bull flags result in continuation; sometimes, the breakout loses momentum. Be prepared to exit the trade if it doesn't play out as expected.
Level Up Your Stock Analysis with MarketBeat
Traders use bull flags to identify potential entry points into the next leg of an uptrend by waiting for a pullback and then entering at the breakout trigger. MarketBeat's libraries of resources and tools can help you identify the pattern, plan entries and exits, and manage risks when trading bull flags.
